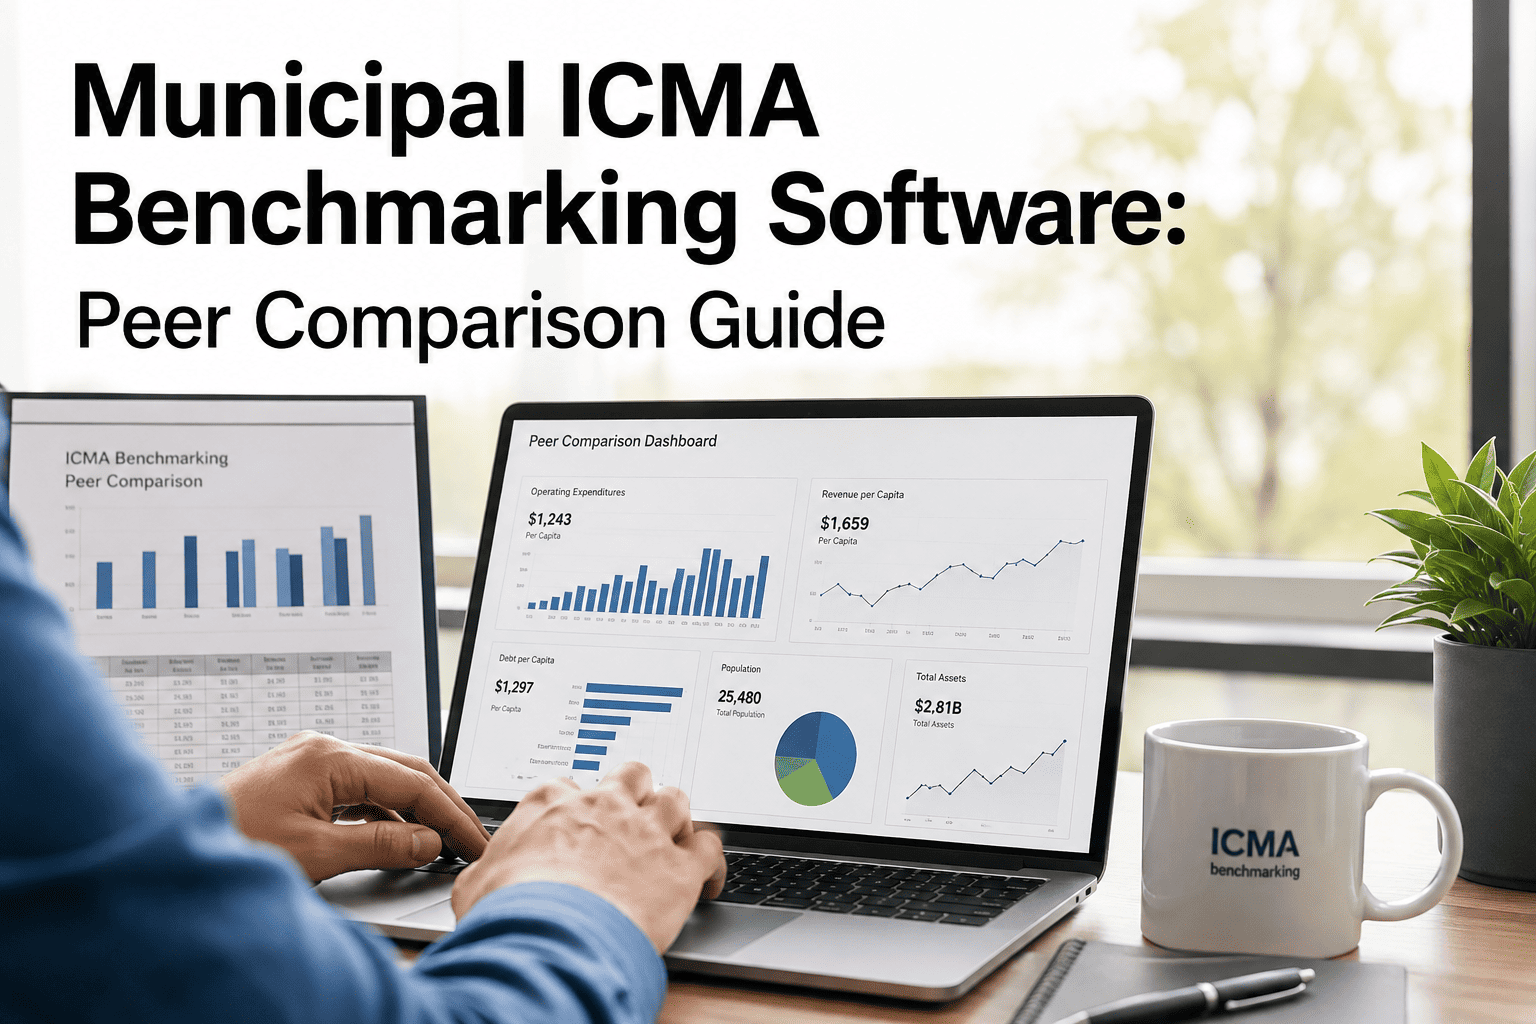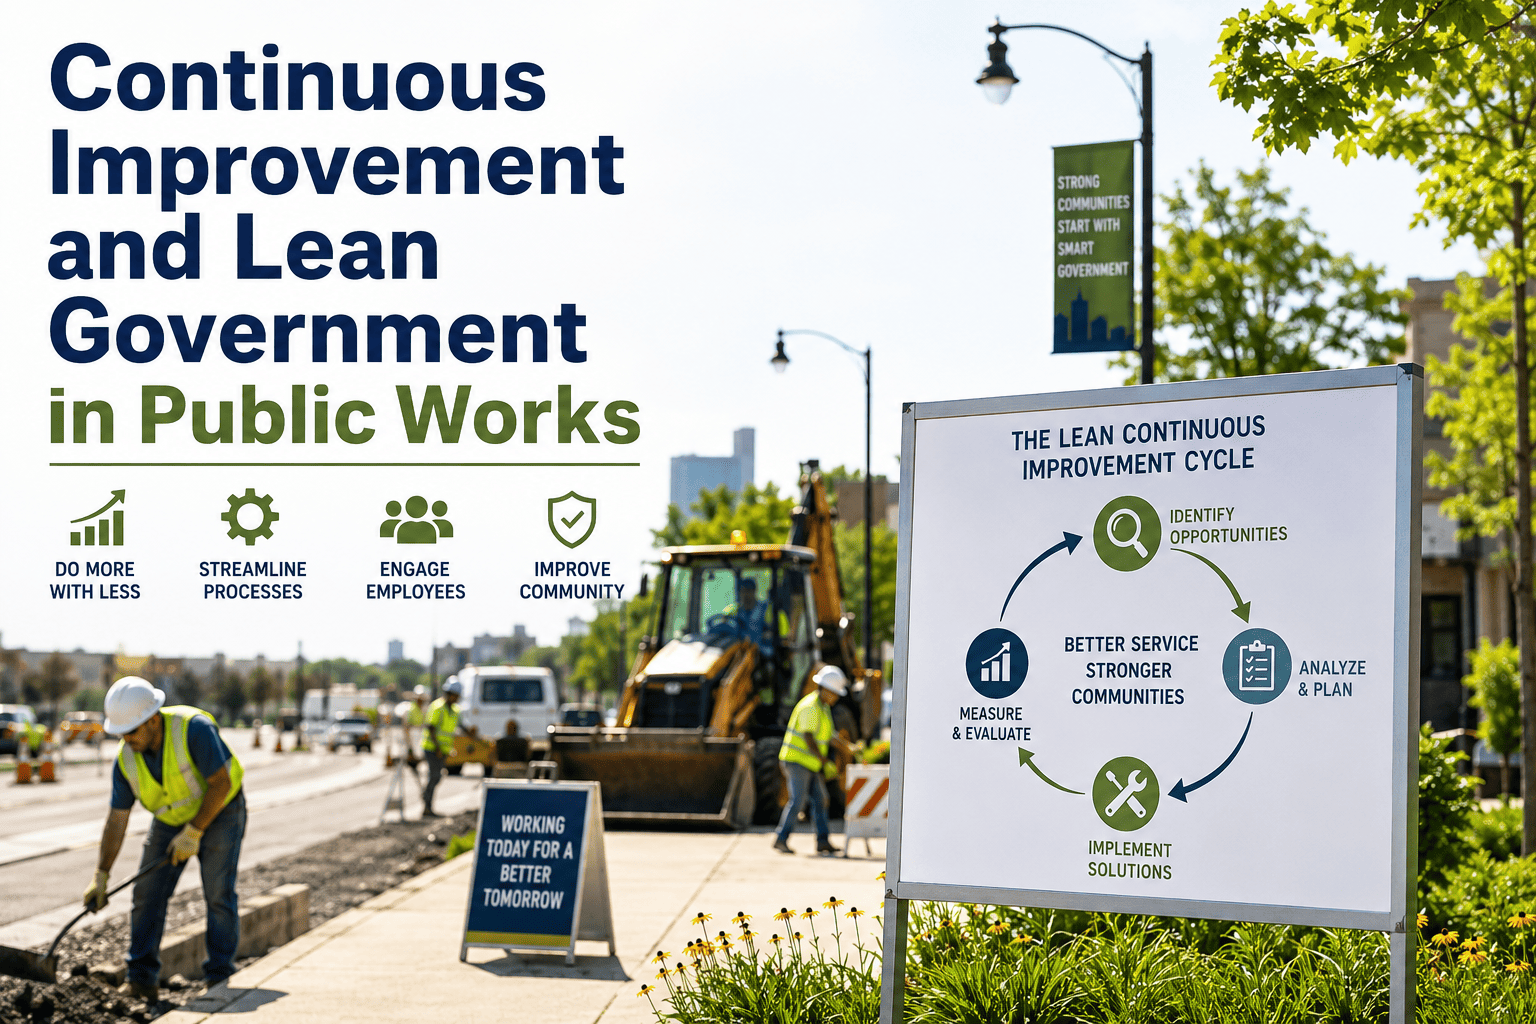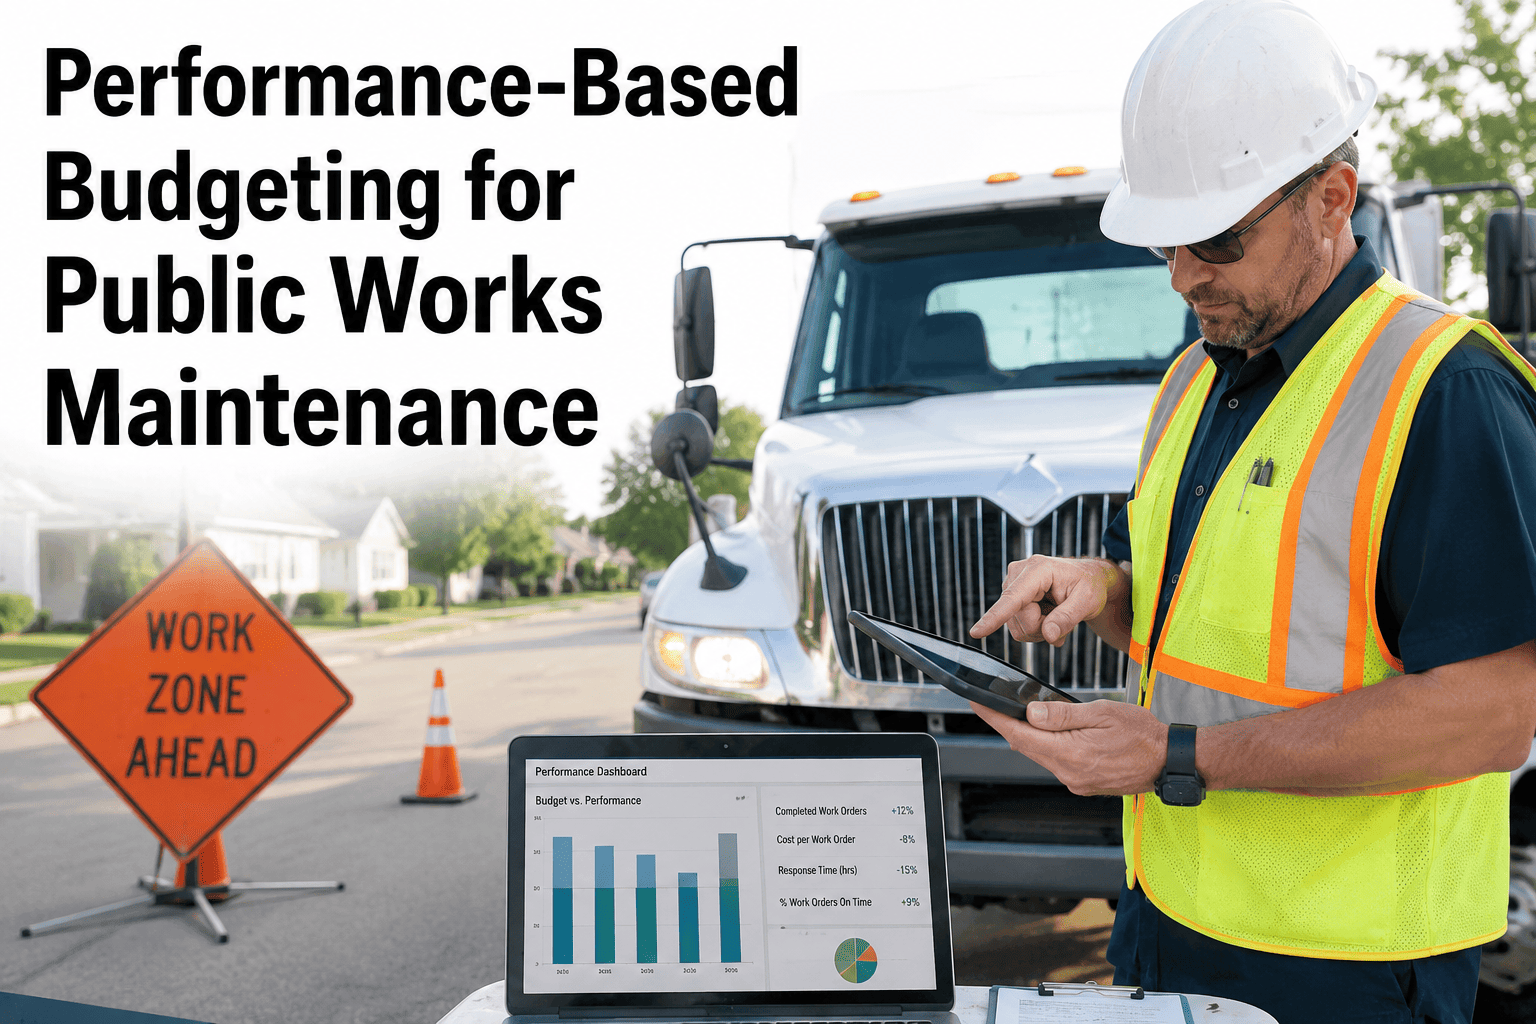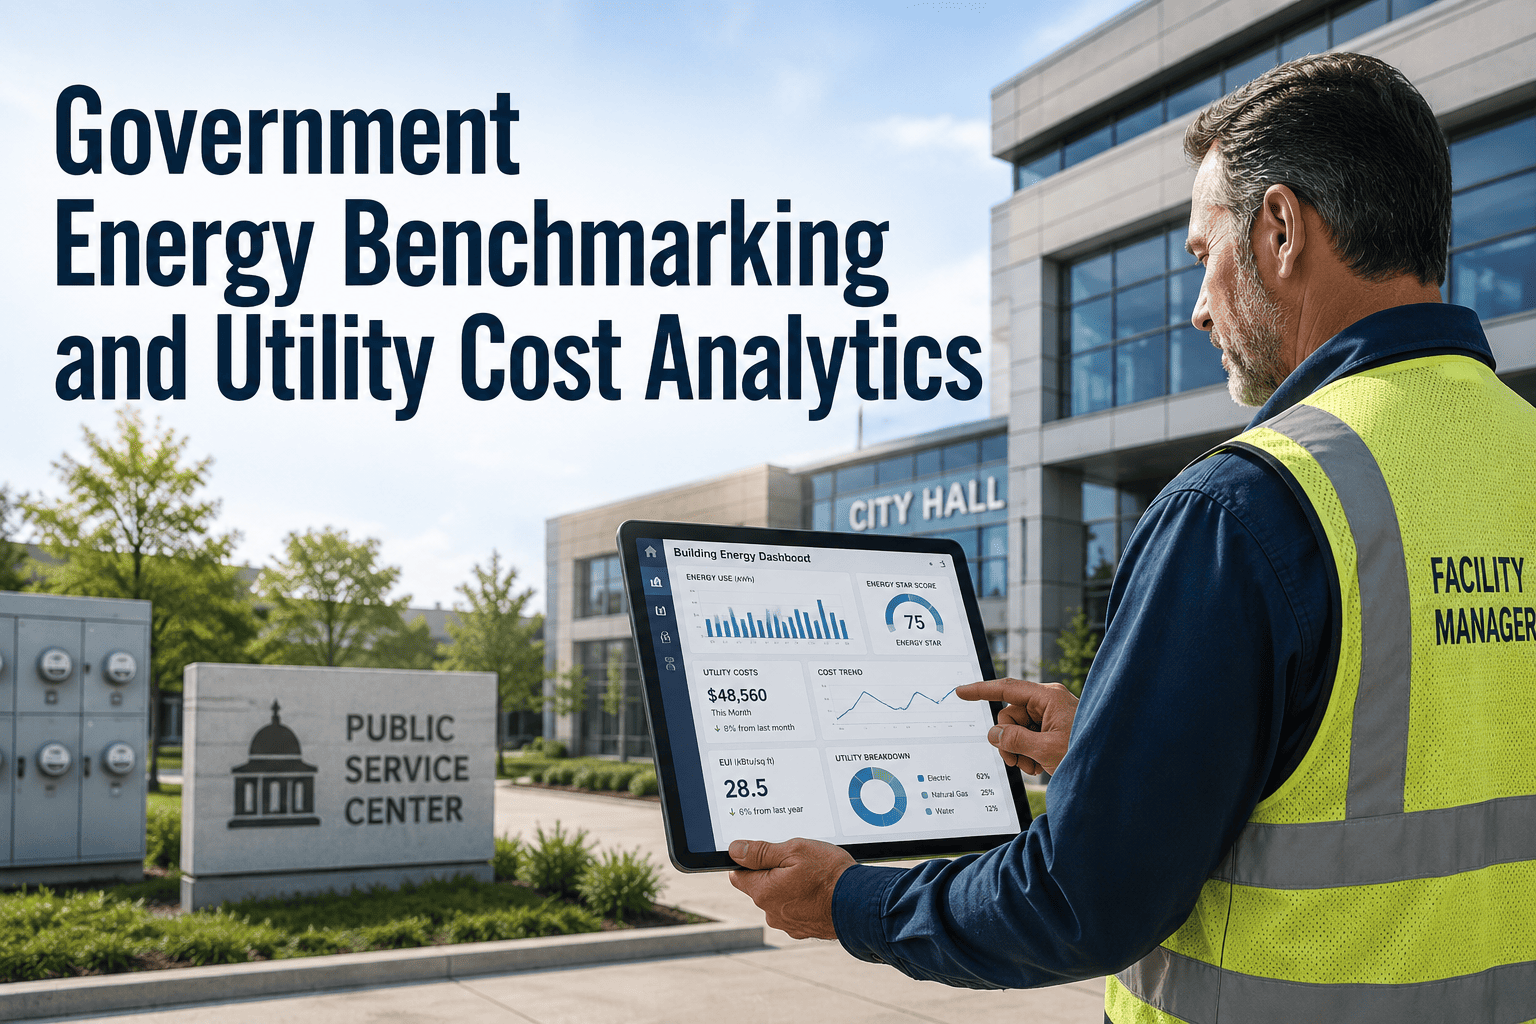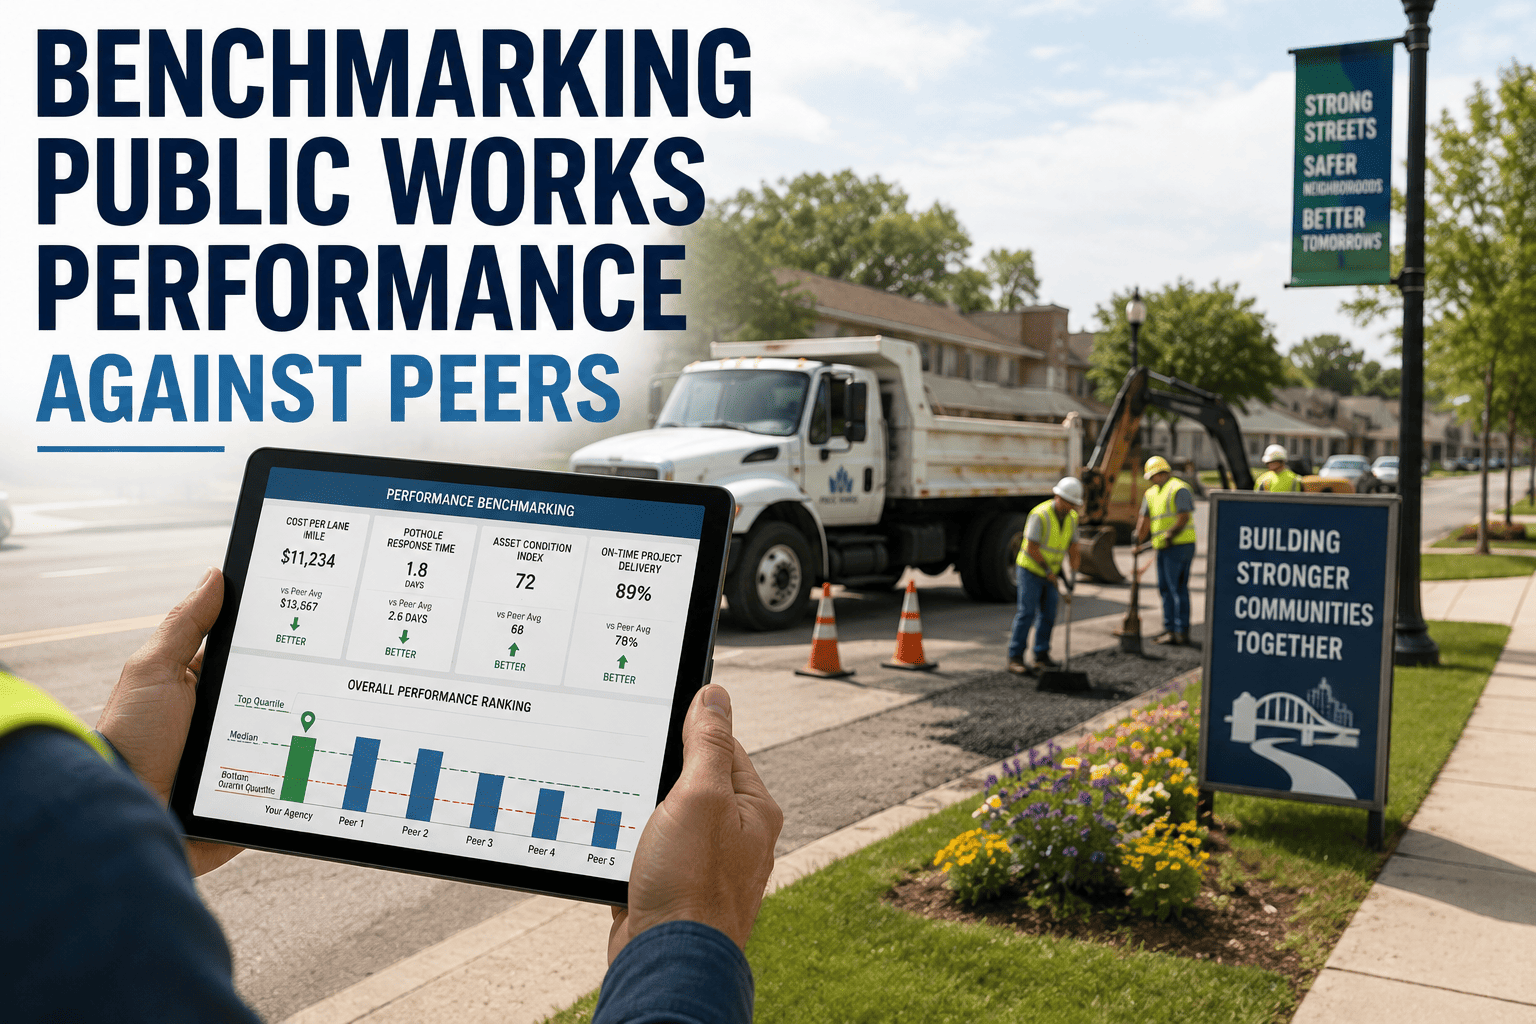
Benchmarking public works performance against peer agencies is the fastest way to discover whether your maintenance operations are leading the field or falling behind. Municipal benchmarking compares key metrics like cost per lane mile, fleet downtime, and work order completion rates against similar government entities to uncover hidden inefficiencies and justify budget requests. When you benchmark municipal performance using standardized data sources, you shift from reactive guesswork to data-driven target setting. OxMaint makes this seamless by automatically tracking and reporting the maintenance analytics you need—so you can Start Free Trial and see exactly where your agency stands.
Are your maintenance costs per asset leading the field — or quietly draining your budget?
Public works benchmarking reveals the gap between your agency's actual performance and peer averages. Without standardized public works metrics benchmarking, you cannot defend budgets, set realistic maintenance targets, or prove the ROI of preventive programs to city councils.
Where to find reliable public works benchmarking data
Effective government benchmarking starts with choosing the right peer set and trusted data sources. Without standard definitions, public sector benchmarking becomes an apples-to-oranges exercise that erodes council confidence.
APWA Benchmarking Program
The American Public Works Association provides standardized public works comparison metrics across 30+ service areas—from fleet maintenance to snow removal—letting you compare your agency against similarly sized municipalities with verified definitions.
GFOA Financial Benchmarks
The Government Finance Officers Association tracks cost-per-unit metrics for municipal services. Pairing GFOA cost data with operational public works performance benchmarking gives a complete picture of efficiency and fiscal discipline.
ICMA & State Consortia
The International City/County Management Association and regional state consortia offer municipal performance benchmarking datasets. These allow highly granular, geography-specific peer comparisons that reflect local labor and material costs.
How to normalize municipal benchmarking data for apples-to-apples comparison
Raw public works comparison data misleads. A 250-truck fleet in Minnesota cannot be directly compared to a 250-truck fleet in Arizona without normalizing for climate, asset age, and labor markets.
| Normalization Factor | Why It Matters in Government Benchmarking | Typical Adjustment Range |
|---|---|---|
| Asset Age Profile | Older fleets and infrastructure require exponentially more corrective maintenance, inflating baseline costs. | +15% to +30% for aging fleets |
| Service Demand / Climate | Snow-belt and coastal agencies face higher seasonal asset stress, work order volumes, and material consumption. | +10% to +25% winter premium |
| Labor & Benefit Rates | Municipal benchmarking must adjust for union contracts, prevailing wage laws, and local benefit obligations. | 0.8x to 1.4x national median |
| In-House vs. Outsourced | Public works benchmark must separate in-house labor from contracted services to avoid masking structural inefficiencies. | Variance up to 40% |
Turning public works peer benchmarking into improvement action
A government performance benchmark is only useful if it drives a maintenance improvement plan. Use a structured gap analysis to prioritize exactly where to deploy resources and CMMS automation.
Measure & Categorize the Gap
Calculate the percentage variance between your agency and the peer median for metrics like PM compliance (%), mean time to repair (MTTR), and reactive maintenance ratio. Flag any variance greater than 10% as a critical priority.
Identify Root Causes
Is a high reactive maintenance ratio caused by aging assets, poor PM scheduling, or lack of spare parts inventory? Map every gap to a specific operational failure—do not assume the cause without asset-level data.
Set Quantified Targets
Set 12-month targets to close the gap with top-quartile peers. Example: reduce reactive work orders from 65% to 40% of total volume by enforcing automated preventive maintenance triggers in your CMMS.
Track & Re-benchmark Quarterly
Public works metrics benchmarking is not a one-time exercise. Re-measure against peers every quarter to prove progress to stakeholders, adjust targets, and secure continued funding for reliability initiatives.
A 1,200-asset public works department closes a $180K efficiency gap
Consider a mid-sized municipal public works department managing 1,200 fleet and facility assets. After participating in an APWA public works benchmarking program, they discovered their reactive maintenance ratio was 62%—22 points higher than the peer median of 40%.
By migrating from paper work orders to OxMaint's AI-powered CMMS, the agency enforced preventive maintenance schedules, tracked spare parts inventory in real-time, and closed the gap within a single fiscal year. The benchmark data made the investment self-justifying.
Automate municipal benchmarking with OxMaint's CMMS analytics
You cannot benchmark public works performance against peers if your maintenance data lives in spreadsheets and filing cabinets. OxMaint standardizes your asset data the moment it is generated.
Real-Time KPI & Benchmark Dashboards
OxMaint automatically tracks MTTR, PM compliance, reactive ratio, and cost-per-asset. Export standardized reports mapped directly to APWA and GFOA metrics—no manual data entry required for your next peer review.
AI-Driven Preventive Maintenance
Close the reactive maintenance gap by automating PM triggers based on meter readings, calendar intervals, and usage patterns. OxMaint predicts failures before they happen, aligning your performance with top-quartile peers.
Asset & Spare Parts Inventory Tracking
Benchmarking municipal services requires knowing exact asset lifecycle costs. OxMaint tracks every asset's history, depreciation, and spare parts usage—giving you the granular cost data needed for true apples-to-apples comparison.
Audit-Ready Compliance Logs
When city councils demand proof of efficiency, OxMaint delivers complete, timestamped digital records of every work order, inspection, and asset repair—justifying budget increases and demonstrating compliance with government standards.
See how your agency stacks up — and where you can gain ground
Book a 30-minute demo and let our team show you how OxMaint tracks the exact public works metrics your peer group uses to benchmark performance.
Public works benchmarking: what teams ask most
What is public works benchmarking?
Public works benchmarking is the process of comparing an agency's operational metrics—such as cost per lane mile, fleet downtime, and PM compliance—against peer municipalities to identify performance gaps and set improvement targets. It relies on standardized data from organizations like the APWA and GFOA to ensure fair, apples-to-apples comparison across different regions and agency sizes.
How do you benchmark municipal performance fairly?
To benchmark municipal performance fairly, you must normalize raw data for variables like asset age, regional labor costs, climate severity, and in-house versus outsourced labor. Without these adjustments, government performance benchmarks become skewed and can lead to misguided budget decisions or unrealistic target setting.
What are the most important public works metrics to benchmark?
The most critical metrics include reactive maintenance ratio, mean time to repair (MTTR), preventive maintenance compliance percentage, cost per asset managed, and overall equipment effectiveness (OEE). Tracking these through a CMMS like OxMaint allows you to automate the data collection needed for accurate public sector benchmarking—book a demo to see the dashboards in action.
Why do agencies fail at performance benchmarking government operations?
Agencies fail at government benchmarking when they rely on manual spreadsheet data that is inconsistent, outdated, or siloed across departments. Without a centralized CMMS to standardize work order data and asset histories, the benchmarking exercise becomes an academic report rather than a tool for driving measurable operational improvement.
How often should we conduct public works peer benchmarking?
You should review internal performance metrics monthly and conduct formal peer benchmarking against external APWA or GFOA data quarterly or annually. Using OxMaint, you can generate standardized benchmark reports on demand, allowing you to track progress continuously rather than waiting for annual survey cycles. You can Start Free Trial to automate this reporting today.
Stop guessing. Start benchmarking with OxMaint.
Join the public works teams using AI-powered maintenance analytics to outperform peer agencies, justify budgets, and eliminate reactive maintenance chaos.
Free 14-day trial · No credit card