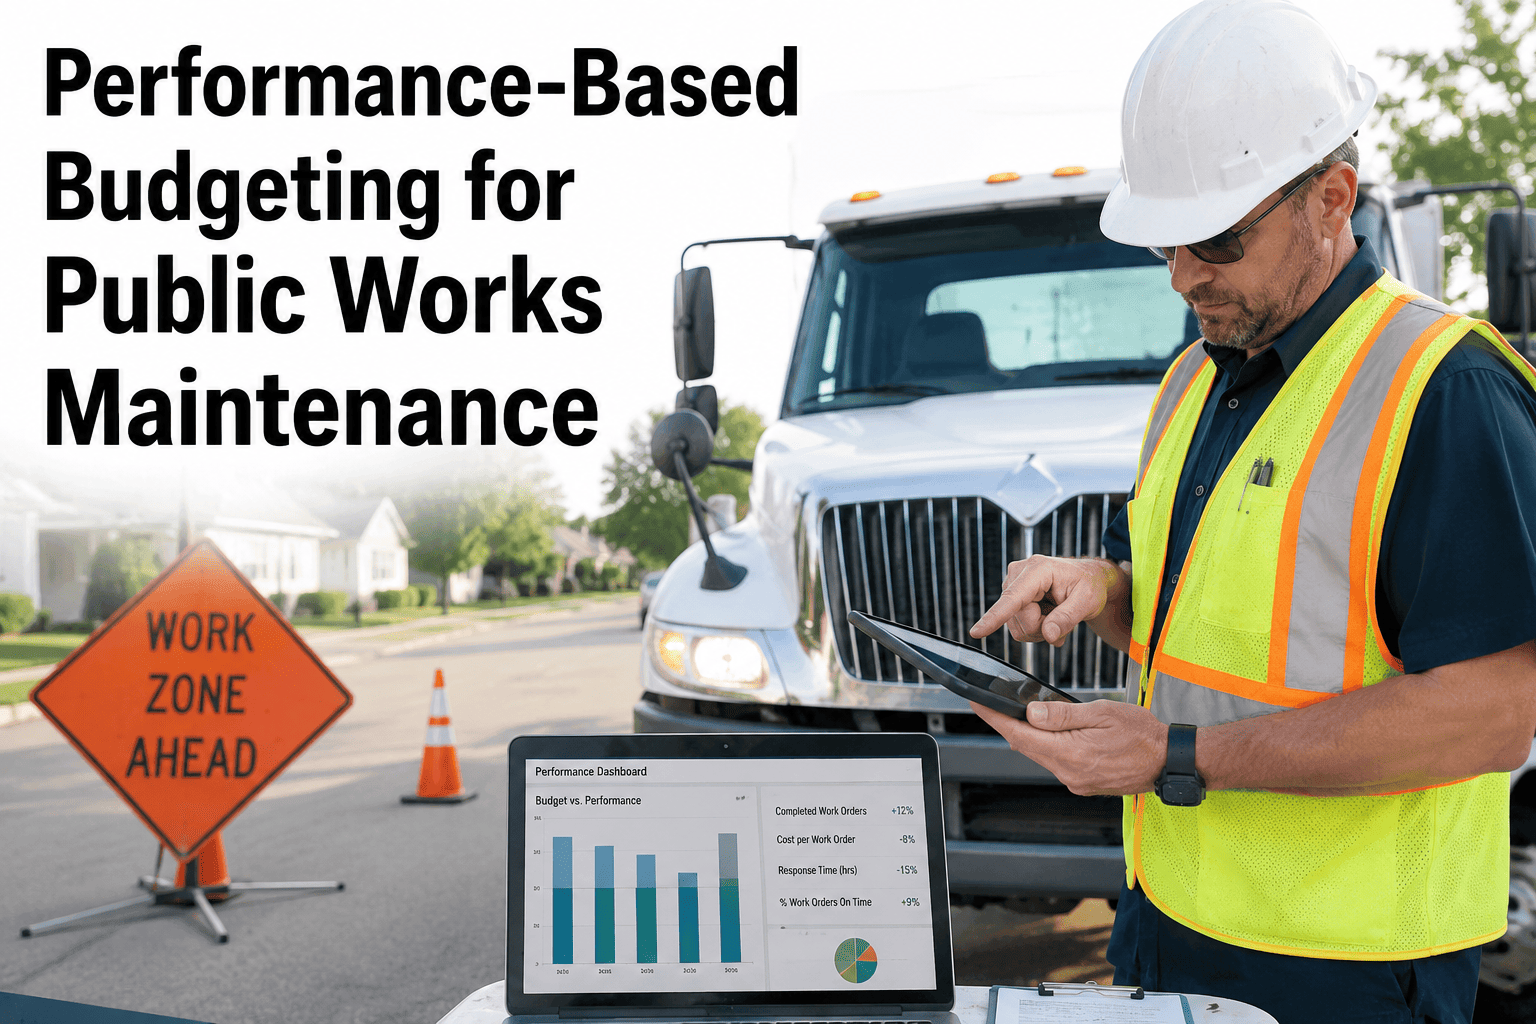
Performance-based budgeting for public works maintenance shifts spending decisions from historical precedent to measurable outcomes — connecting every dollar requested to asset condition, service levels, and risk reduction. Municipal agencies that adopt outcome-based budgeting consistently secure better allocations because they can defend requests with real data rather than "what we spent last year plus 3%." Public works departments using a CMMS like OxMaint can automate the evidence trail, making performance budgeting defensible, repeatable, and fast. Start Free Trial to see how quickly your asset data turns into budget-ready evidence.
PERFORMANCE BUDGETING FOR PUBLIC WORKS
Can you defend next year's maintenance budget with data — or just last year's spreadsheet?
Performance-based budgeting ties every public works maintenance dollar to measurable condition, service-level, and risk outcomes. Agencies that make the shift report 15–30% better budget outcomes within two cycles — and far fewer "cut 10% across the board" surprises from the council chamber.
CORE FRAMEWORK
What is performance-based budgeting for public works?
Performance-based budgeting (PBB) is a budgeting model that links funding requests to specific, measurable outcomes rather than incremental history. In a municipal maintenance context, that means your budget request doesn't say "we need $1.2M for street maintenance" — it says "we need $1.2M to raise average PCI from 62 to 68, reduce pothole-related claims by 40%, and extend overlay life by 4 years." Outcome-based budgeting government models force the same discipline: define the result, measure progress, and fund what works.
Replace "last year + inflation" with outcome-driven math. Every line ties to an asset condition, service level, or compliance target you can measure in a CMMS.
Translate vague goals ("keep roads safe") into measurable targets: PCI ≥ 65, pump-station uptime ≥ 99.2%, work-order backlog ≤ 14 days. Each outcome needs a baseline number and a target.
Pull 12 months of CMMS data — asset condition scores, MTBF, PM compliance %, reactive-vs-preventive ratio. This is your evidence base. Spreadsheets won't survive a budget hearing; structured asset records will.
Map each outcome to a dollar figure. Show the gap between current condition and target, the interventions required, and the cost per unit of improvement. Rank by cost-effectiveness and risk.
Present a one-page performance dashboard per program. Council sees outcomes, not line items. After approval, track actuals against targets monthly and feed results into next year's request.
THE COST OF DOING NOTHING
What happens when public works budgets stay history-based
Agencies that budget by inertia share predictable symptoms. Without outcome data, maintenance becomes invisible — until something fails publicly. The cost of reactive, history-driven budgeting shows up in three places: asset failure, political vulnerability, and lost funding to departments that can tell a better story.
A mid-size municipality maintaining 180 critical assets (pumps, HVAC units, fleet vehicles) spends $420K/year on maintenance, 55% reactive. After implementing OxMaint CMMS and shifting to performance-based budgeting, the agency cuts reactive work to 28% in 18 months, avoids $87K in emergency repair costs, and secures a 12% budget increase by showing council a PCI improvement plan tied to measurable outcomes — the first increase in five years.
HOW OXMAINT HELPS
How OxMaint powers data-driven budgeting for public works
Performance-based budgeting lives or dies on the quality of your underlying data. OxMaint's AI-powered CMMS and EAM platform gives you the asset condition records, work-order history, and maintenance analytics you need to build defensible, outcome-linked budget requests — without spending weeks manually assembling spreadsheets.
Asset Condition Tracking
Centralized asset registry with condition scores, lifecycle stage, and failure history for every pump, vehicle, and piece of infrastructure. Gives you the baseline numbers your budget request needs — and the trend lines that show what happens if you underfund.
PM Compliance & Work Order Analytics
Track preventive maintenance completion rates, reactive-vs-preventive ratios, and mean time between failures automatically. These are the exact KPIs council members and auditors ask for when evaluating whether last year's budget delivered results.
Maintenance Cost Analytics
Real-time cost rollups by asset, asset class, work type, and program. Know exactly what each pump, each vehicle, each road segment costs to maintain — and model what different funding levels would buy in terms of condition improvement.
Audit-Ready Reporting
One-click performance dashboards exportable to PDF for council presentations and budget hearings. Every dollar is traceable to an asset, a work order, and an outcome — the transparency that performance budgeting public sector frameworks require.
BEFORE & AFTER
Performance-based vs. traditional public works budgeting
The difference between incremental and performance-based municipal budgeting isn't just philosophical — it changes what gets funded, how you justify it, and whether your department grows or shrinks. Here's how the two models compare when the council asks "why do you need this?"
| Dimension | Traditional (Incremental) | Performance-Based |
|---|---|---|
| Budget basis | Last year's actuals + inflation adjustment | Target outcomes + cost to achieve them |
| Defense in hearings | "We've always needed this amount" | "$1.2M raises PCI from 62 to 68, cuts claims 40%" |
| Data source | Spreadsheet exports, manual compilation, anecdote | CMMS analytics: condition scores, WO history, cost rollups |
| Risk visibility | Implicit — "we know it's bad" | Quantified — failure probability, consequence, cost of deferral |
| Council response to cuts | "Cut 10% everywhere" — no basis to argue | "Cut $X = Y condition drop, Z added risk" — informed trade-offs |
| Accountability | Spend tracked; outcomes assumed | Outcomes tracked monthly; spend tied to results |
| Typical budget outcome | Flat or declining in real terms | 15–30% improvement within 2 cycles |
PILLARS OF DEFENSIBILITY
Four data pillars every performance budget request needs
A performance-based budget request is only as credible as the data behind it. Council members and finance directors look for four evidence types before approving maintenance funding above historical levels. Build each pillar into your CMMS and your requests become nearly impossible to dismiss.
Asset Condition Baseline
Current condition score for every asset class in your system — PCI for roads, condition index for buildings, health score for pumps and vehicles. Without a baseline, "we need more money" is an opinion. With one, it's a measurable gap.
Work History & PM Compliance
12 months of work-order data showing PM completion rate (target ≥ 90%), reactive-to-preventive ratio (target ≤ 30:70), and mean time to repair. This proves you're spending current funds efficiently before asking for more.
Cost-per-Outcome Model
Translate maintenance spending into units of improvement: $X per PCI point gained, $Y per percentage point of uptime increase, $Z per day of backlog reduction. This lets council compare your request against other departments on equal terms.
Risk & Consequence Data
Probability and consequence of failure for critical assets, with dollar-quantified impact. "If we defer this $40K PM, the likely failure costs $150K and 3 days of service disruption" is a trade-off council can evaluate — and usually decides in your favor.
TURN ASSET DATA INTO BUDGET EVIDENCE
See OxMaint on your assets — book a 30-minute demo
Walk through a live CMMS environment with condition tracking, cost analytics, and one-click budget dashboards. We'll map your asset data to a performance-based budget framework in real time.
FREQUENTLY ASKED QUESTIONS
Performance-based budgeting for public works: common questions
What is performance-based budgeting in public works maintenance?
Performance-based budgeting links maintenance funding requests to measurable outcomes — condition scores, service levels, uptime targets — rather than incremental history. Instead of "last year + 3%," you request dollars tied to specific results: "$1.2M to raise PCI from 62 to 68." A CMMS like OxMaint provides the asset condition, work-order, and cost data that makes each request defensible. Start Free Trial to see how your data maps to a budget framework.
How does a CMMS support performance budgeting for municipalities?
A CMMS provides the four data pillars performance budgets require: asset condition baselines, work-order and PM compliance history, cost-per-outcome analytics, and risk/consequence data. Instead of manually assembling spreadsheets for budget hearings, maintenance teams export live dashboards showing exactly what current spending achieves and what additional funding would buy in improved outcomes.
What KPIs should a public works performance budget track?
Core KPIs include PM compliance rate (target ≥ 90%), reactive-to-preventive work ratio (target ≤ 30:70), mean time between failures, asset condition index, work-order backlog days, and cost per unit of condition improvement. These metrics prove current funds are spent efficiently and quantify what additional investment would deliver — the evidence council needs to approve increases.
How long does it take to implement performance-based budgeting?
Agencies with a CMMS already in place can produce their first data-backed performance budget in one budget cycle (6–12 months). Those starting from spreadsheets typically need 3–6 months of CMMS data collection before the first outcome-based request. Book a demo at calendly.com/oxmaintapp/30min to see a realistic timeline for your asset portfolio.
What's the difference between performance-based and zero-based budgeting?
Zero-based budgeting requires every line item to be justified from scratch each cycle, regardless of history. Performance-based budgeting focuses on justifying funding through measurable outcomes rather than incremental changes. PBB is more practical for public works because it retains continuity while adding accountability — you fund outcomes, not just activities, and you can demonstrate whether last year's spending achieved its targets.
READY TO BUILD YOUR DATA-BACKED BUDGET?
Stop defending maintenance budgets with last year's spreadsheet
OxMaint gives you the asset condition data, work-order analytics, and cost-per-outcome models that make performance-based budgeting work. Book a demo and see your first budget-ready dashboard in under 30 minutes.
Free 14-day trial · No credit card