Every public works director has sat in a council meeting and heard the same question in a different wrapper: "how does that compare to other cities?" Without a benchmarking discipline, the honest answer is usually a guess dressed up as confidence. ICMA's Center for Performance Measurement built its peer comparison model precisely because guessing doesn't hold up — cities that report standardized metrics for PM completion, work order cycle time, and street condition against a defined peer group can answer that question with a number instead of an anecdote, and can earn recognition like the Certificate of Distinction for doing it well. The challenge is rarely deciding to benchmark; it's pulling clean, consistent metrics out of a CMMS that wasn't built with peer comparison in mind. Start a free trial with Oxmaint to see standardized municipal KPIs generate themselves from the work orders your crews already close.
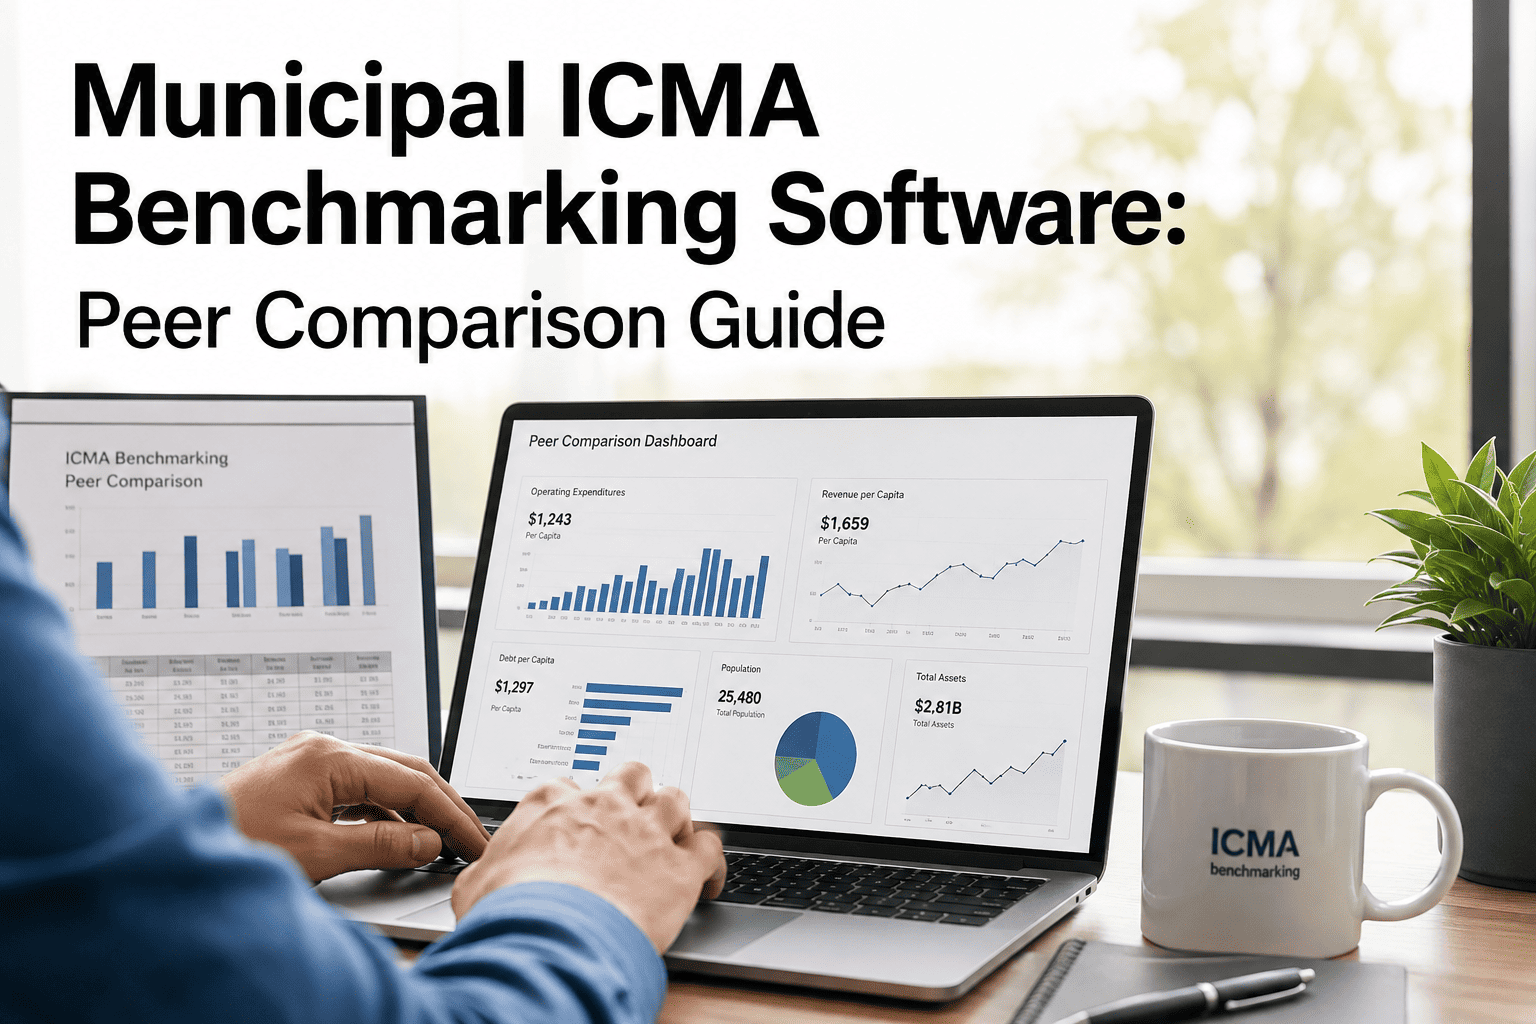
Municipal ICMA Benchmarking Software Built for Honest Peer Comparison
Generate the standardized PM completion rate, work order cycle time, and street quality metrics ICMA-aligned benchmarking depends on, straight from the work orders your crews already close.
What ICMA Benchmarking Actually Asks Cities to Do
ICMA's performance measurement approach asks local governments to track standardized metrics across public works, fleet, parks, and other service areas, then compare results against a defined peer group of similarly sized jurisdictions rather than against an internal target nobody outside city hall has ever seen. The comparison only works if the underlying data is collected the same way every reporting cycle — the same definition of a completed preventive maintenance task, the same clock start and stop for a work order cycle, the same method for scoring pavement condition.
Cities that pursue formal recognition, such as ICMA's Certificate of Distinction, go a step further: they publish the data, verify it for reliability, train staff on consistent reporting, and actually use the results in budget and operational decisions rather than filing them away after the annual report is published. None of that is possible if the source data lives in scattered spreadsheets that different crews fill out differently.
Six Metrics Municipal Benchmarking Programs Track Most
The share of scheduled preventive maintenance tasks completed on time across facilities, fleet, and infrastructure assets.
Average time from a work order being opened to being closed, typically split between routine and emergency requests.
A scored condition index across the street network, used to compare resurfacing and repair investment against peers.
The percentage of the fleet available for service on any given day, a direct reflection of preventive maintenance discipline.
Open work orders as a share of total volume, showing whether a crew is keeping pace with demand or falling behind it.
Maintenance spend normalized per lane-mile, per vehicle, or per facility square foot, for a fair cost comparison across peer cities.
A Sample Peer Comparison: Your City vs. Peer Median vs. Top Quartile
Illustrative comparison. Actual peer positioning depends on your reporting cohort and metric definitions.
Why Most Benchmarking Efforts Break Before the Comparison Even Starts
| Data Problem | Why It Happens | Effect on the Comparison |
|---|---|---|
| Inconsistent Definitions | Crews mark "complete" differently between shifts or departments | Metric no longer measures the same thing across the fleet |
| Manual Data Entry | Cycle times calculated by hand at month end | Delayed, error-prone numbers nobody fully trusts |
| Siloed Systems | Fleet, facilities, and streets tracked in separate tools | No single source of truth to report against a peer group |
| Standardized CMMS Data | One system logging every work order the same way | A metric worth publishing and defending in council |
Turn Closed Work Orders Into Benchmark-Ready Metrics
Oxmaint standardizes how PM completion, cycle time, and backlog are calculated across every department, so the numbers you report to council match the numbers ICMA-style peer comparison expects.
Getting Certificate-of-Distinction-Ready Without a Reporting Scramble
Programs like ICMA's Certificate of Distinction expect more than a single year of decent numbers — they expect published data, a documented data verification process, trained staff reporting consistently, and evidence the metrics actually influence budget and operational decisions. Cities that try to assemble this retroactively from a season of email threads and spreadsheet versions usually find gaps right when a reviewer asks the hardest questions.
A CMMS that calculates PM completion, cycle time, and backlog automatically from work order data solves the harder half of that requirement before the reporting deadline arrives. The metric is already standardized, already time-stamped, and already tied to a specific crew, asset, and service area — which is exactly the kind of audit trail a peer comparison, or a council member reviewing a rate discussion, expects to see.
How Oxmaint Supports Municipal ICMA-Style Benchmarking
PM completion, cycle time, and backlog calculate the same way across every department, so the numbers hold up when compared against peer cities.
Combine fleet, facilities, streets, and parks data into one reporting view instead of stitching together exports from separate systems.
Track each metric year over year, so improvement — or decline — is visible before it becomes the headline in a budget hearing.
Generate a report formatted for council presentations or a peer benchmarking submission without rebuilding charts from scratch each cycle.
Every metric traces back to the individual work orders behind it, giving reviewers and residents a verifiable data path, not just a summary number.
Normalize spend per lane-mile, per vehicle, or per facility square foot automatically, so cost comparisons against peer cities stay apples to apples.
What Changes Once Benchmarking Runs on Real Data
Frequently Asked Questions
What is ICMA benchmarking for cities?
It is a performance measurement approach where local governments track standardized service metrics and compare results against a peer group of similarly sized jurisdictions rather than internal targets alone. Start a free trial to see standardized metrics generated from your own work order data.
Which metrics matter most for a first benchmarking effort?
PM completion rate, work order cycle time, and street or pavement condition are the most commonly tracked starting points because they are collected by most public works departments already. Book a demo to see these calculated automatically.
Why do benchmarking comparisons often fall apart?
Inconsistent definitions between crews or departments and manually reconciled spreadsheets are the most common causes, since they make the "same" metric mean different things across the data set.
Can a CMMS support a Certificate of Distinction application?
Yes. A CMMS that calculates metrics consistently and keeps a work-order-level audit trail directly supports the data verification and reporting consistency these recognition programs expect.
How often should peer comparison metrics be reviewed?
Quarterly internal review keeps departments accountable, while an annual comparison against the wider peer group is typical for public reporting and council presentations.
Give Your City a Peer Comparison Worth Standing Behind
Oxmaint standardizes PM completion, work order cycle time, and street quality metrics across every department, so your next benchmarking report is built on real, traceable data instead of a spreadsheet reconstruction — free trial, no credit card required.