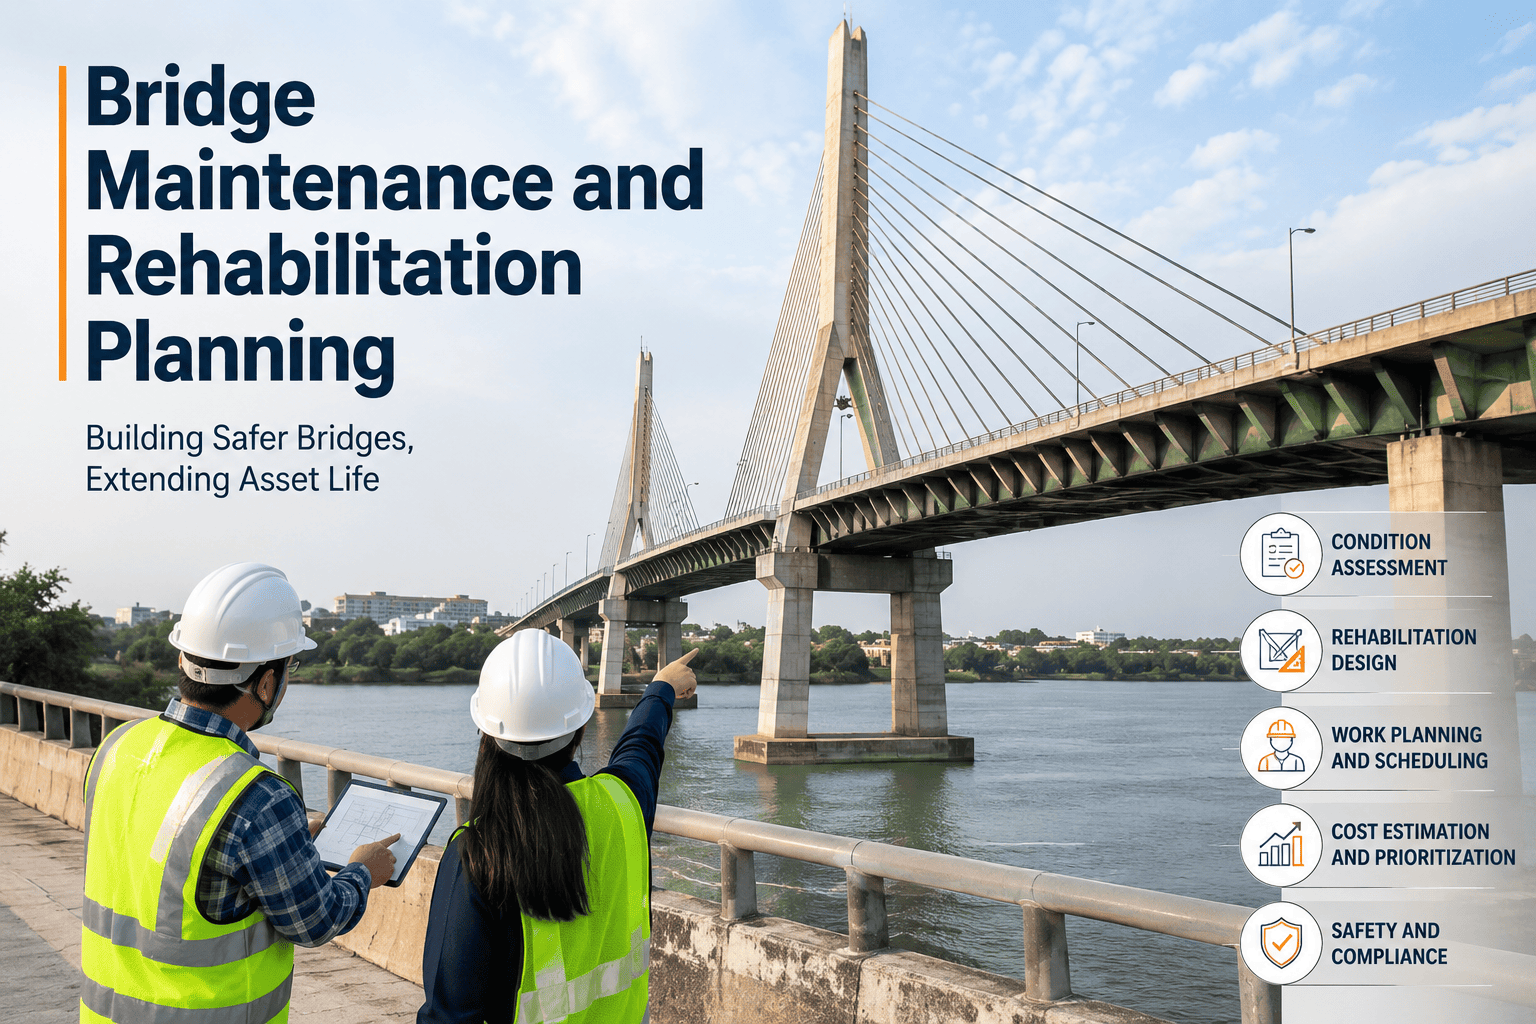
A bridge that reaches the end of its service life without a maintenance plan behind it does not fail quietly — it fails as an emergency closure, a twenty-minute detour added to every daily commute, and a replacement bill that runs into the tens of millions. Close to half of all bridges in the country are currently rated in fair condition, meaning they are one deferred inspection cycle away from sliding into poor condition. The average highway bridge is now pushing past four and a half decades old, and the national backlog of rehabilitation work has climbed past 190 billion dollars, a figure that grows every year preservation work gets pushed to next year's budget. For a public works engineer managing a municipal bridge inventory, the difference between a 300,000 dollar preservation project and a 30 million dollar replacement is often nothing more than a three to five year maintenance window that was allowed to close. This guide walks through how to build a bridge maintenance and rehabilitation plan that catches deterioration inside that window, and how Oxmaint keeps that plan on schedule for public works teams.
Roads, Bridges & Pavement · Public Works Engineering
Bridge Maintenance and Rehabilitation Planning
Where your bridge inventory sits today decides what next year's budget looks like. Here is how the condition curve actually moves — and where a planning system changes the outcome.
Share of national bridge inventory by condition rating — the fair-condition band is where preservation dollars go furthest
The Cost Curve Every Bridge Engineer Already Knows
A bridge does not deteriorate at a constant rate, and neither does the cost of fixing it. The same structural problem addressed one condition band earlier can cost a fraction of what it costs one band later — which is exactly why the fair-condition window is the highest-leverage point in the entire life cycle.
1
Good
Routine inspection and light preventive maintenance keep a structure in this band for decades. Deck sealing, joint cleaning, drainage clearing, and bearing lubrication are the standard scope of work here, and none of it requires lane closures or detours.
Typical spend: baseline · Timeline impact: none
2
Fair
The preservation window. Cracking and minor section loss appear, but the structure is still fully serviceable. Targeted rehabilitation now — deck overlays, joint replacement, coating repair — can extend service life by twenty-five years or more at a small fraction of replacement cost.
Typical spend: 5–10x baseline · Timeline impact: weeks
3
Poor
Section loss, spalling, and exposed reinforcement move from cosmetic to structural. Load restrictions and lane closures often follow. Rehabilitation is still possible, but scope has grown enough that it now competes directly with full replacement on cost and schedule.
Typical spend: 20x baseline · Timeline impact: months
4
Deficient
Weight restrictions, emergency closure, or full replacement become unavoidable. Detour costs, emergency contracting premiums, and public safety exposure stack on top of the construction bill — the outcome every earlier stage exists to prevent.
Typical spend: 40x baseline+ · Timeline impact: years
See Where Every Bridge In Your Inventory Sits On This Curve
Oxmaint turns inspection history, NBI condition ratings, and cost data into a live capital priority queue for your bridge inventory — so the fair-to-poor transition never happens unnoticed.
Condition Rating to Action: What Each Band Actually Requires
Every bridge rehabilitation program runs on the same underlying logic — the condition rating tells you which action band a structure falls into, and the action band tells you roughly what it will cost and how disruptive the work will be. Mapping your inventory against this table is the first step in any credible capital plan, and it is the same table a state DOT or federal funding reviewer will expect to see behind a rehabilitation request.
| Condition Rating |
Typical Finding |
Recommended Action |
Relative Cost |
| Good (8–9) |
No significant deficiencies noted |
Routine inspection, drainage and joint upkeep |
Baseline |
| Satisfactory (7) |
Minor deck wear, early scour signs |
Preventive maintenance, deck sealing |
1–2x baseline |
| Fair (5–6) |
Cracking, spalling, section loss beginning |
Preservation or rehabilitation project |
5–10x baseline |
| Poor (below 4) |
Advanced deterioration, load-bearing concerns |
Major rehabilitation, load posting, or replacement |
20x baseline or higher |
| Fracture-Critical / Scour-Critical |
Single-point-of-failure members or unknown foundation risk |
Tightened inspection interval plus priority monitoring, regardless of overall rating |
Varies by finding |
From Inspection Finding to Funded Capital Project
The gap between a documented inspection finding and an approved capital dollar is where most bridge programs lose time. A structured planning cycle closes that gap in four repeatable steps.
1
Inspect and Rate
Routine inspections run on the required cycle, with shorter intervals for fracture-critical and underwater structures. Element-level condition ratings, field notes, and photo evidence are captured in a structured digital record instead of a paper form that sits in a filing cabinet until someone remembers to enter it.
2
Score and Prioritize
Condition rating, consequence of failure, detour length, and daily traffic volume are weighted together into a single score. That score produces a ranked list showing exactly which structures need funding first — not the loudest complaint, the highest actual risk.
3
Plan and Budget
The ranked list feeds a rolling multi-year capital improvement plan that councils and boards can review against real condition trends and cost history, rather than a bridge-by-bridge argument every budget season.
4
Execute and Track
Approved projects become tracked work orders with assigned crews, contractors, and completion deadlines. Finished work flows straight back into the next inspection cycle's condition record, so the plan updates itself instead of starting from zero.
Expert Review
SB
Senior Bridge Engineer
Municipal Public Works, Structures Division, 21 Years
Every bridge that ends up as an emergency closure was a fair-rated bridge at some point, and somewhere in that window there was a decision to wait one more budget cycle. The inspection report is never the problem — the report always says what needs to happen next. What breaks down is the link between the finding and the funding request, especially when that link runs through spreadsheets that nobody outside the structures office ever opens, or a binder that only gets pulled out once a year before the annual DOT certification. When condition history, cost trend, and consequence of failure sit in one place that a council member can actually look at without a translator, the preservation project gets approved instead of deferred again. That single change in visibility is worth more to a bridge inventory than almost any amount of extra inspection frequency.
Frequently Asked Questions
How often does a municipal bridge need to be inspected?
Routine bridge inspections are required on a set cycle, with shorter intervals for fracture-critical and underwater structures.
Oxmaint schedules and tracks every inspection interval automatically against your inventory.
What is the real difference between preservation and rehabilitation?
Preservation is lower-cost work applied to good or fair bridges to keep them from declining further. Rehabilitation addresses deficiencies already present in a deteriorated structure and costs considerably more per project.
How should we decide which bridge gets funded first?
Condition rating, consequence of failure, and traffic volume together produce a defensible ranked queue.
Book a demo to see how that ranking is generated automatically from inspection data.
Can preventive maintenance actually extend a bridge's service life?
Yes — systematic preventive maintenance programs have been shown to extend service life by 25 years or more when applied while a structure is still in good or fair condition, deferring replacement significantly.
What data do we need to justify a bridge capital request to council?
Inspection history, condition trend over several years, and cost-per-structure data make the strongest case.
Start building that history now so it is ready before the next budget cycle.
Plan Your Bridge Inventory Before The Next Condition Rating Drops
Oxmaint gives public works engineers one place to manage inspection scheduling, condition history, and capital prioritization for every structure in the inventory — so preservation happens on schedule, not in crisis.