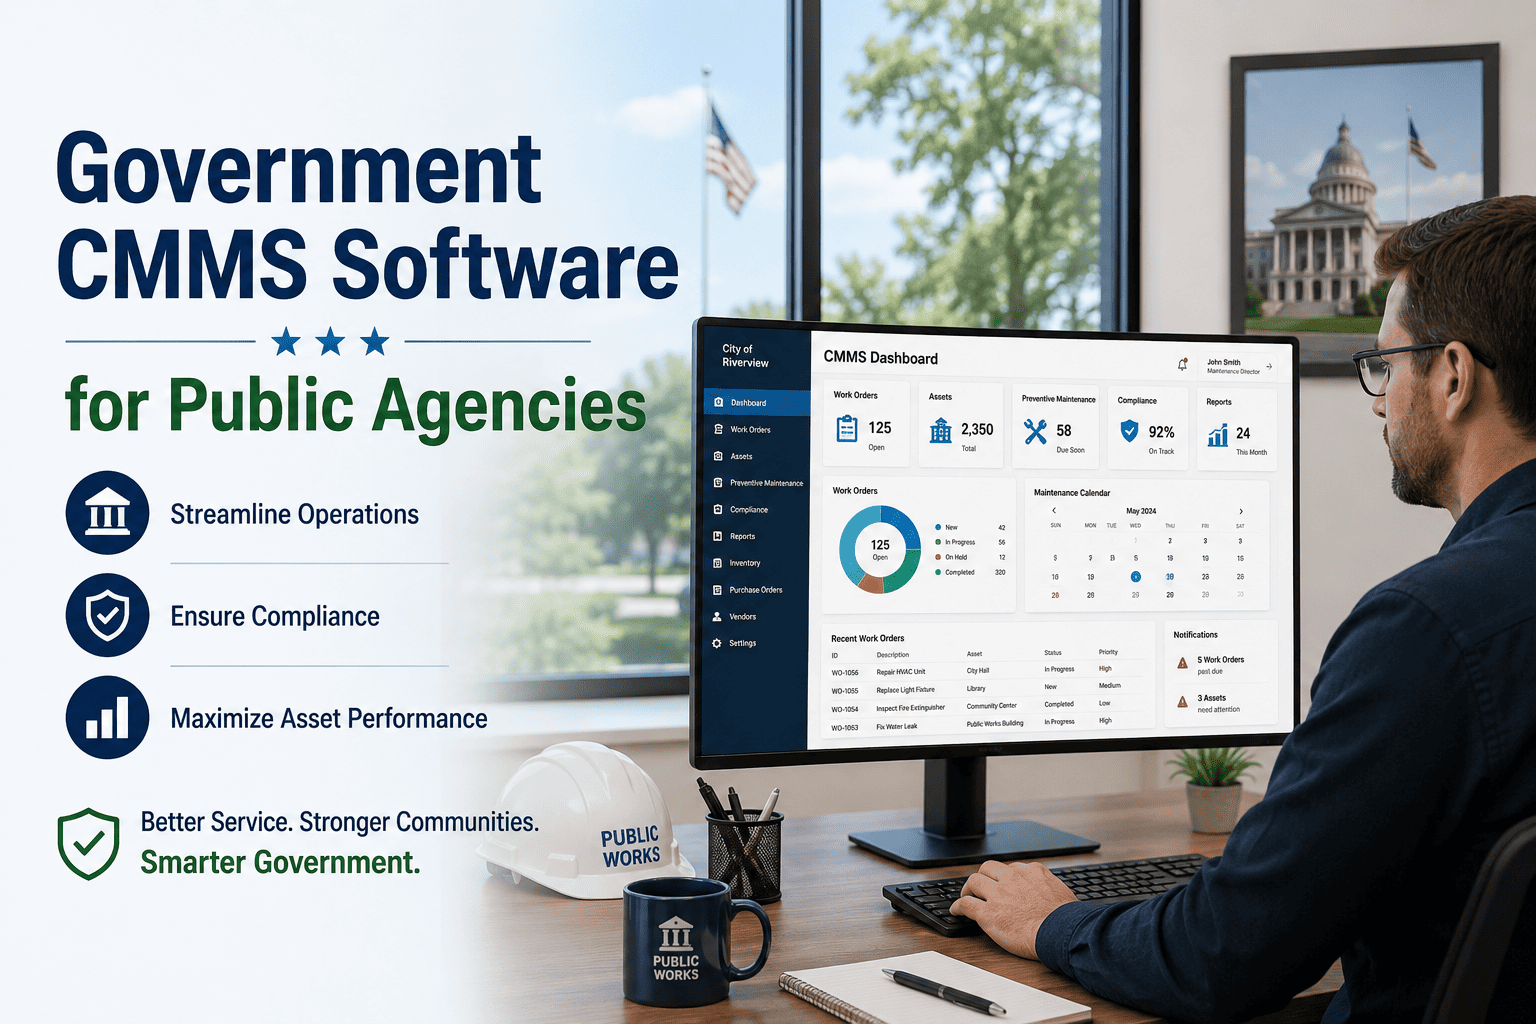
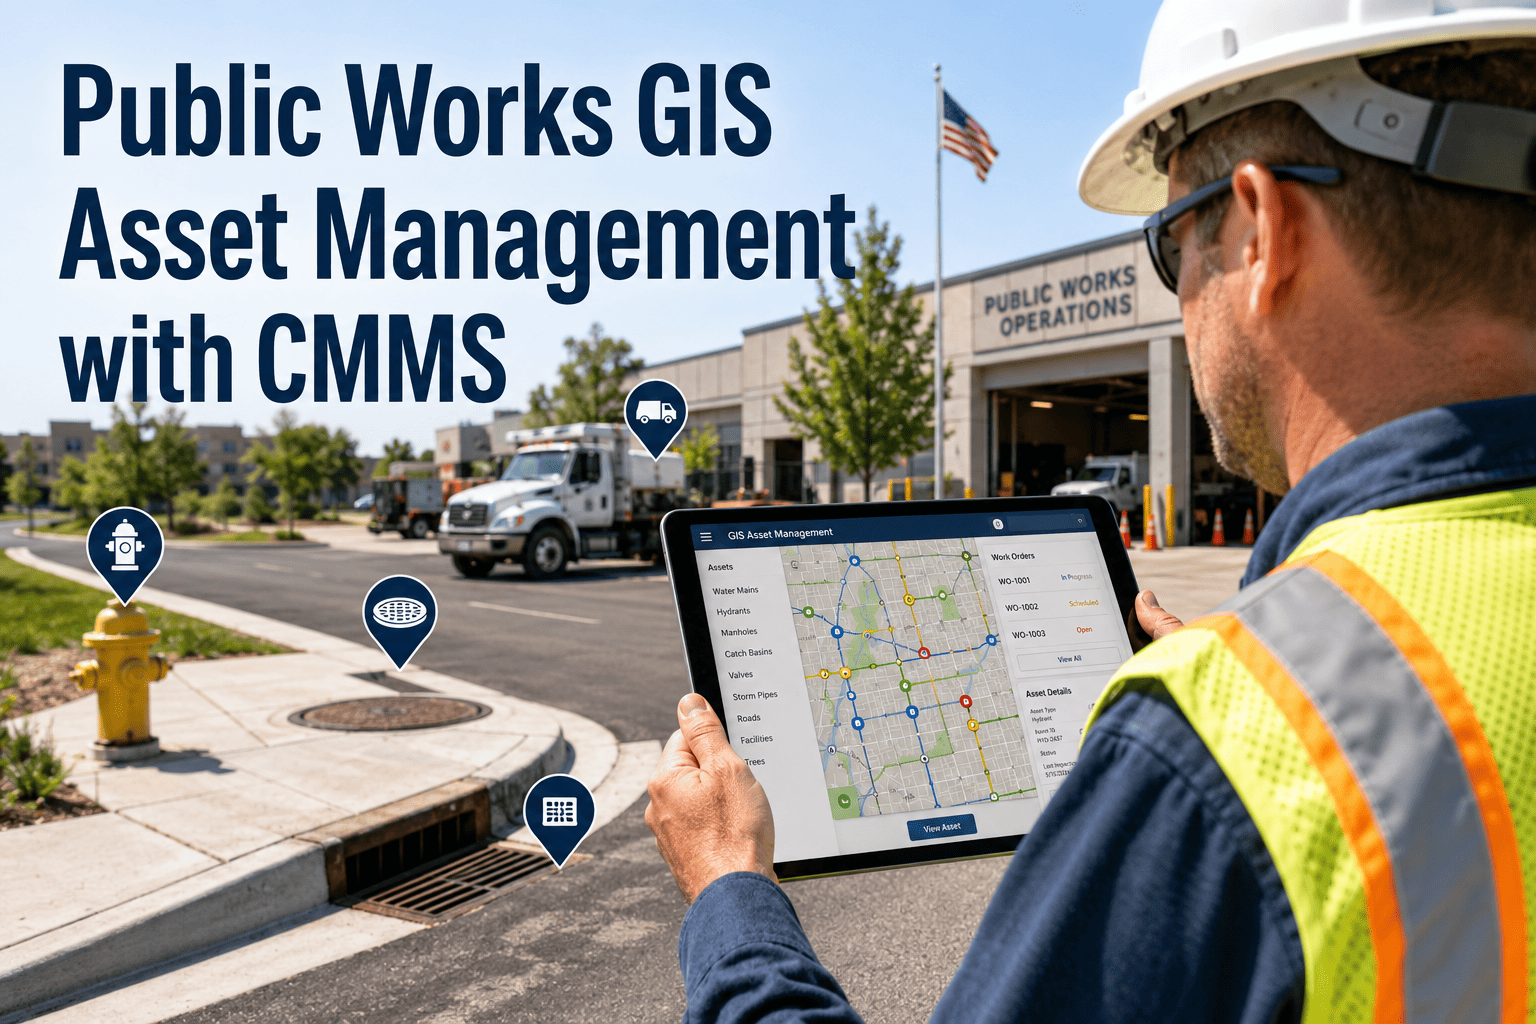
Government Maintenance Budget Planning: Maximizing Taxpayer Value with Data-Driven Decisions
By Taylor on March 6, 2026
The city council meeting lasted four hours. The public works director requested $3.8 million for preventive maintenance across 340 municipal buildings, 1,200 miles of water mains, 14 pump stations, and 47 vehicles — the same request he had made, with minor adjustments, for six consecutive years. The council approved $2.1 million — a 45% cut — citing "no evidence that the full amount is necessary" and "competing priorities for taxpayer dollars." Eleven months later, a boiler at the community center failed during a February cold snap. Emergency replacement: $185,000. A sewer lift station pump seized from deferred bearing maintenance. Emergency repair plus overtime plus environmental response: $340,000. Three fleet vehicles failed DOT inspection from deferred brake and suspension work — taken out of service during peak snow season. Rental replacements: $94,000. Total cost of the $1.7 million budget cut: $619,000 in emergency spending in a single fiscal year — and those were just the failures that made the incident reports. The maintenance backlog grew by another $2.4 million in deferred work that will cost 3–5× more when it eventually fails. The public works director had the right number. He just couldn't prove it. Without CMMS data — asset condition scores, failure histories, cost-per-asset trends, and deferred maintenance risk projections — his budget request was an opinion competing against other opinions for the same limited dollars. Data-driven budget requests get funded. Anecdotal requests get cut. Schedule a consultation to see how CMMS data transforms your next budget presentation from a request into an evidence-based business case that elected officials can defend to taxpayers.
Government Budget Intelligence 2026
Every Dollar You Can't Justify Is a Dollar the Council Will Cut
CMMS-powered budget justification, deferred maintenance risk quantification & capital improvement planning for municipalities
72%
Budget Requests Cut Without Data
47%
Avg. Municipal PM Budget Underfunded
3–5×
Emergency Cost vs. Planned Repair
$1T+
US Deferred Municipal Maintenance Backlog
The Five Budget Failures That Cost Municipalities Millions
Government maintenance budgets are cut for the same reasons every year — and the consequences compound annually. Each failure traces to a single root cause: the inability to present maintenance spending as a measurable investment with quantifiable returns rather than an opaque cost that can be safely deferred. Five specific budget failures account for the gap between what municipalities need and what they receive, and every one is solvable with CMMS data.
The Five Root Causes of Municipal Maintenance Budget Shortfalls
01
Anecdotal Requests
Budget requests based on "we think we need this" instead of documented condition data and failure cost history
72% of requests cut by councils
02
Invisible Deferred Risk
Councils cannot see the compounding cost of deferred maintenance — so they defer more to fund visible projects
Backlog compounds 15–20%/year
03
No Cost-Per-Asset Data
Without lifecycle cost tracking, there is no way to demonstrate whether maintenance spending is efficient or wasteful
30–40% of budget misallocated
04
Emergency Spending Hidden
Emergency repair costs are buried in general maintenance line items — councils never see the 3–5× premium they are paying
$619K+ in hidden emergency costs
05
No ROI Demonstration
Maintenance is presented as a cost, not an investment — so councils treat it like any discretionary expense that can be reduced
PM delivers 400% ROI — unproven
Every one of these failures is solvable with CMMS data. Cost-per-asset histories prove where money is spent. Failure trending shows which assets are approaching emergency thresholds. Deferred maintenance risk models quantify what budget cuts will cost in emergency spending. And ROI calculations demonstrate that every dollar of preventive maintenance avoids $3–$5 of emergency repair. Facilities managers ready to build data-driven budget cases can start their free trial and begin collecting the evidence their next budget presentation needs.
The Four Pillars of Data-Driven Budget Justification
Elected officials approve budgets they can defend to voters. A defensible maintenance budget requires four categories of evidence: what condition are assets in, what does maintenance actually cost, what happens if we defer spending, and what return does each dollar generate. CMMS platforms generate all four as a byproduct of daily maintenance operations — transforming annual budget battles into data presentations that win approval.
Evidence-Based Budget Framework for Municipal Maintenance
01
Asset Condition Evidence
Condition scores per assetDeterioration trend curvesPhoto documentationRemaining useful life data
02
True Cost Transparency
Cost per asset classPlanned vs. emergency splitLabor + parts breakdownYear-over-year trending
03
Deferred Risk Quantification
Backlog dollar valueEmergency cost projectionsService failure probabilityLiability exposure modeling
04
ROI Demonstration
Cost avoidance per PM dollarAsset life extension valueEnergy savings quantifiedGrant funding enabled
Budget Performance Standards: What Funded Departments Measure
Municipalities that consistently win full budget approval track and present specific KPIs that demonstrate fiscal accountability, operational efficiency, and investment return. Without documented metrics linked to financial outcomes, maintenance budgets compete against every other department using the same subjective arguments. CMMS-generated KPIs transform maintenance from an overhead cost into a measurable investment with tracked returns. Schedule a demo to see how these metrics generate automatically from daily work orders.
Municipal Maintenance Budget KPIs — What Councils Need to See
Swipe to view all columns →
Budget KPI
Top Quartile
Average
Underfunded
Data Source
Planned vs. Reactive Ratio
80/20 planned
55/45 split
20/80 reactive
CMMS Work Orders
PM Completion Rate
>90%
65–75%
<50%
CMMS PM Module
Emergency Spend % of Total
<10%
25–35%
>50%
CMMS Cost Reports
Deferred Maintenance Backlog
<5% of CRV
10–20% of CRV
>30% of CRV
Condition Assessment
Cost per Sq Ft Maintained
$2.50–$4.00
$4.00–$6.50
>$8.00
CMMS + Facility Data
Maintenance ROI Ratio
>400%
200–300%
<100%
Cost Avoidance Data
Each KPI auto-generates from CMMS data — no separate compilation required. Top-quartile departments present these metrics quarterly to maintain continuous council confidence in maintenance investment.
See Budget-Ready Reports Generate Automatically
Watch how OxMaint transforms daily work order data into the cost-per-asset, planned vs. reactive, and deferred maintenance risk reports that win council budget approval — in one 30-minute demo.
Real-Time Budget Intelligence: From Work Orders to Council Reports
When every work order captures asset ID, labor hours, parts cost, and work type classification, the CMMS automatically generates the budget intelligence that finance committees require. Planned vs. reactive ratios show whether the department is preventing failures or chasing them. Cost-per-asset trending reveals which equipment is approaching replacement thresholds. And deferred maintenance risk modeling quantifies exactly what each dollar of budget cut will cost in emergency spending next year.
Municipal Maintenance Budget Intelligence Center
FY2026 Live Tracking
Planned vs. Reactive
74/26
Target: 80/20 | Up from 42/58 baseline
PM Completion Rate
88%
Target: 90% | 247 of 281 PMs on time this month
Emergency Spend
14% of total
Target: <10% | Down from 48% baseline
Cost Avoidance YTD
$1.2M
Documented PM savings vs. projected emergency costs
Deferred Backlog
$4.7M
Down from $7.2M — trending toward target <$3M
Maintenance ROI
380%
Every $1 PM investment avoids $3.80 in emergency costs
The ROI of Data-Driven Budget Management
Municipalities that present CMMS-generated budget evidence consistently achieve higher approval rates, lower emergency spending, and faster backlog reduction. The numbers below represent documented outcomes from municipalities of 25,000–100,000 residents that transitioned from anecdotal to data-driven budget presentations within 12–24 months of CMMS implementation.
Annual Impact: CMMS-Powered Budget Management
Documented outcomes for mid-sized municipalities (25,000–100,000 residents)
Budget Approval Rate
Data-backed requests vs. anecdotal submissions
55% funded
92% funded
+37 pts
Emergency Spending
Reactive emergency costs eliminated by PM program
$1.8M/year
$450K/year
$1.35M saved
Deferred Backlog Growth
Annual backlog increase stopped and reversed
+$2.4M/year
-$800K/year
$3.2M swing
Grant Competitiveness
Federal/state grant awards using CMMS condition data
$200K won
$1.7M won
$1.5M more
Total Annual Value of Data-Driven Budget Management
$6.05M+
CMMS platform cost: $25K–$75K/year — ROI exceeds 80:1 when accounting for budget approval improvement, emergency avoidance, and grant competitiveness
Expert Perspective: Budget Battles Are Data Battles
"
For twelve years I walked into budget hearings with a spreadsheet and a story. 'We need $3.8 million because our buildings are old and things break.' The council heard that from every department. They funded what they could see — new parks, road resurfacing, police vehicles — and cut what was invisible: HVAC maintenance, roof inspections, pump station PM. Then we implemented CMMS and for the first time could show the council a chart: here is what we spent on emergency boiler replacement at the community center last winter — $185,000 — and here is the PM schedule that would have prevented it — $4,200 in annual bearing inspections and oil analysis. That one slide changed more minds than twelve years of storytelling. The next budget passed at 92 cents on the dollar. We didn't change our ask. We changed our evidence.
— Director of Public Works, Mid-Size Municipal Government
92%
Budget Approval Rate
Municipalities presenting CMMS-generated evidence achieve 85–95% budget approval vs. 45–60% for anecdotal requests
400%
Maintenance ROI
Every $1 invested in preventive maintenance avoids $3–$5 in emergency repair — documented through CMMS cost tracking
75%
Emergency Cost Reduction
Data-driven PM programs reduce emergency spending 60–80% within 24 months — the savings fund the next PM expansion
The shift from anecdotal budget requests to evidence-based investment cases is the single most impactful change a public works director can make. For operations managers evaluating where to start, the answer is clear: begin tracking every work order with asset ID, cost, and work type classification. Within 12 months, the CMMS will have generated enough data to produce the cost-per-asset, planned vs. reactive, and deferred risk reports that transform budget presentations. Schedule a consultation to build your data-driven budget strategy.
Win Your Next Budget Battle with Data, Not Stories
Join municipalities using OxMaint to generate the cost-per-asset, planned vs. reactive, deferred maintenance risk, and ROI evidence that elected officials need to approve full maintenance funding — automatically, from daily work order data.
What CMMS data do we need to build an evidence-based budget request?
An evidence-based maintenance budget requires five categories of CMMS data, all generated automatically from daily work order completion: Asset Inventory — every building, vehicle, pump, HVAC system, and infrastructure component registered with condition score and remaining useful life. Work Order Cost History — every completed WO linked to an asset with labor hours, parts cost, and total cost, classified as planned PM, corrective, or emergency. Planned vs. Reactive Ratio — the percentage of work orders that are scheduled preventive maintenance versus unplanned emergency repairs, trended monthly and annually. Deferred Maintenance Backlog — the dollar value of known maintenance work that has been identified but not funded, with projected failure dates and emergency cost estimates. Cost Avoidance Documentation — specific examples where PM prevented failures, with calculated cost avoidance based on the difference between PM cost and estimated emergency replacement cost. OxMaint generates all five data categories from the same work orders your technicians complete every day — no separate data collection effort required. Start your free trial to begin building your budget evidence base.
How do we quantify deferred maintenance risk for council presentations?
Deferred maintenance risk quantification converts the abstract concept of "deferred work" into specific dollar amounts that councils can evaluate. OxMaint calculates deferred risk through three components: Probability of Failure — based on asset age, condition score, and failure history, each deferred maintenance item is assigned a probability of failure within the next fiscal year. Consequence of Failure — the estimated emergency repair cost (typically 3–5× planned cost), plus service disruption impact, plus any regulatory or safety liability. Risk Dollar Value — probability × consequence = the risk-adjusted cost of deferring each maintenance item. When aggregated across the entire deferred backlog, this produces a single number: "If the council funds $0 of the deferred backlog, the expected emergency cost next year is $X." That number transforms budget discussions from opinion-based to evidence-based. Book a demo to see deferred risk quantification in action.
How does CMMS data improve grant competitiveness?
Federal and state grant programs — FEMA HMGP, BRIC, SRF, ARPA infrastructure allocations, and HUD CDBG — increasingly score applications on the quality of asset condition documentation. Municipalities with CMMS-generated data submit applications with: condition-assessed asset inventories documenting specific deterioration, risk-ranked capital improvement plans with consequence-of-failure analysis, maintenance cost history demonstrating operational stewardship, and deferred maintenance backlog quantification showing the urgency of requested funding. This evidence package scores dramatically higher than applications supported only by age data and engineering estimates. Municipalities using OxMaint report 40–60% improvement in grant award rates after implementing data-driven asset management — because grant reviewers can verify that the applicant maintains assets responsibly and has quantified the specific need.
How long does it take to generate enough CMMS data for budget justification?
The timeline depends on your starting point, but useful budget data begins accumulating from Day 1 of CMMS operation. Within 30 days, you have work order cost data showing planned vs. reactive classification and cost-per-asset for every completed maintenance event. Within 90 days, you have enough data to calculate monthly planned vs. reactive ratios and identify your highest-cost assets. Within 6 months, you have quarterly trends showing whether emergency spending is declining as PM completion rises — the core ROI narrative. Within 12 months, you have a full fiscal year of data including seasonal patterns, year-over-year comparisons, and enough failure history to build credible deferred maintenance risk projections. Most municipalities present their first data-driven budget within 12–18 months of CMMS deployment. The departments that start capturing data now will have a full evidence base ready for next year's budget cycle. Start your free trial today — every work order completed from this point forward is budget evidence.
How do we present maintenance ROI to non-technical elected officials?
Elected officials respond to three types of evidence: specific cost comparisons (not averages), visual trend data (not spreadsheets), and constituent impact stories (not technical metrics). OxMaint generates council-ready presentations using all three: Specific Examples — "This boiler PM costs $4,200/year. When we skipped it in 2023, the emergency replacement cost $185,000." Show the specific asset, specific costs, and specific consequence. Visual Trends — charts showing emergency spending declining as PM completion rises, with dollar values on both axes. Councils can see the correlation instantly. Constituent Impact — "This pump station serves 8,400 households. A $12,000 annual PM program prevents the $340,000 emergency failure that shut off water to those households for 36 hours last March." Connect every maintenance dollar to the residents it protects. The most effective budget presentations are 10 slides: 3 specific failure-to-cost examples, 2 trend charts, 2 deferred risk projections, 1 ROI summary, 1 budget request tied to specific outcomes, and 1 what-happens-if-you-cut scenario. Schedule a consultation and we will help you build that presentation from your OxMaint data.