When county commissioners review utility bills showing the courthouse consuming $45,000 monthly in energy costs—30% higher than comparable buildings—they demand answers. When summer heat waves force the public library to close because aging HVAC systems can't maintain safe temperatures, community complaints flood social media. When EPA energy audits identify civic buildings wasting hundreds of thousands annually through inefficient heating and cooling, budget pressure intensifies. Yet most county facilities managers fight these battles reactively, addressing HVAC failures and energy spikes after they impact operations and budgets.
This guide provides county facilities managers with actionable strategies for optimizing HVAC performance and reducing energy consumption through predictive maintenance, IoT monitoring, and AI analytics. Counties ready to transform civic building operations can start building their energy optimization system today.
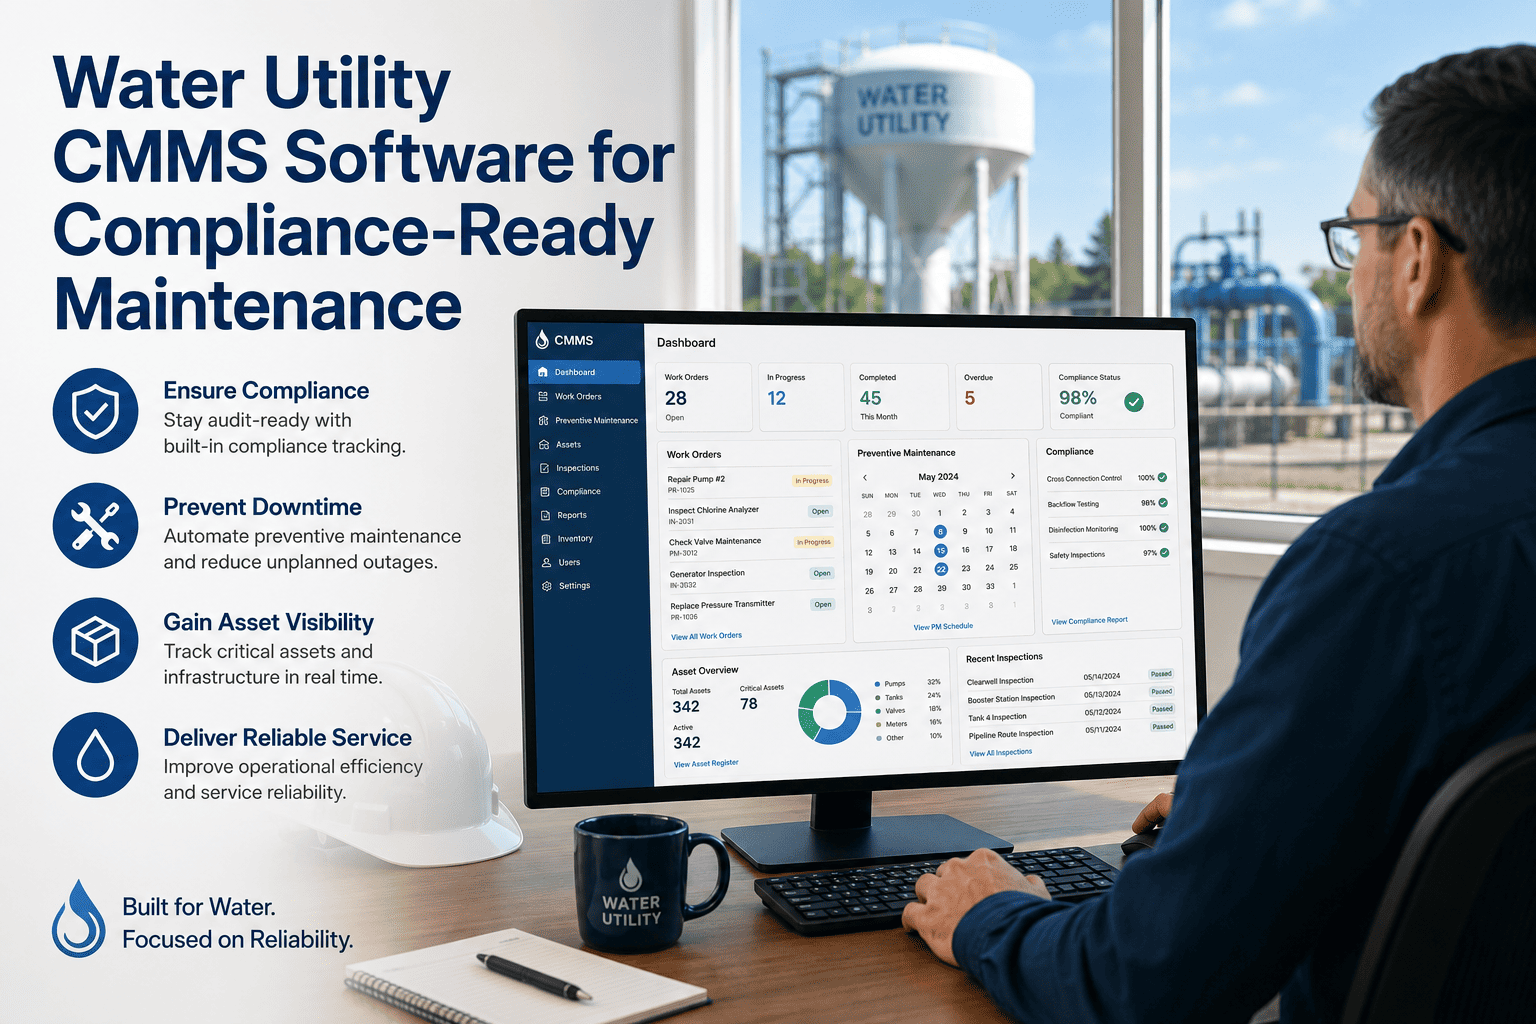
Cut Civic Building Energy Costs by 28% Through Predictive HVAC Maintenance
Counties waste $343K-$678K annually on preventable HVAC energy costs. IoT monitoring + AI analytics deliver immediate 20-35% savings while preventing summer cooling failures.
Why County Buildings Waste Energy
IoT + AI Energy Management System
Modern energy optimization requires real-time visibility and intelligent automation. This 5-layer architecture enables predictive maintenance while maximizing efficiency.
IoT Sensor Network
Building-wide sensors (50-200 nodes per facility) transmitting temperature, humidity, pressure, airflow, power consumption data every 15-60 seconds.
Data Integration Platform
CMMS connects IoT sensors, BMS, utility meters, weather APIs into unified data lake for comprehensive analysis.
AI Analytics Engine
Machine learning predicts equipment failures 48-72 hours early, detects efficiency degradation, identifies optimization opportunities.
Automated Control Optimization
System automatically adjusts HVAC schedules, setpoints, equipment staging based on occupancy forecasts and weather predictions.
Mobile Work Order Execution
Predictive alerts auto-generate work orders with OEM procedures. Crews complete tasks via mobile app with barcode/QR verification.
What This Technology Enables
Predictive Chiller Maintenance
Monitor refrigerant pressure, compressor amp draw, temperature differentials detecting problems 2-3 weeks before failure during peak cooling season.
Occupancy-Based Scheduling
AI learns building use patterns adjusting HVAC automatically: courthouse full Monday-Thursday, library busy after school.
Dynamic Setpoint Optimization
Micro-adjustments (+/- 2°F) based on outdoor conditions maintaining comfort while reducing energy 8-12%.
Demand Response Automation
Automatically reduce HVAC loads during utility peak pricing earning rebates while maintaining acceptable conditions.
Book a Custom Demo
See how IoT + AI reduces energy costs while preventing HVAC failures in buildings like yours.
Energy Optimization by Facility Type
Different civic buildings require customized strategies based on unique occupancy patterns and equipment demands.
Courthouses
Libraries
Community Centers
Admin Buildings
120-Day Energy Optimization Roadmap
Baseline & Quick Wins
- Conduct energy audits identifying worst-performing buildings
- Install IoT sensors on critical HVAC equipment
- Implement no-cost fixes: schedules, dampers, filters
- Document baseline energy consumption
Predictive Systems
- Configure AI analytics identifying efficiency degradation
- Implement occupancy-based scheduling
- Deploy mobile inspection app with barcode/QR
- Create energy dashboards for leadership
Advanced Optimization
- Fine-tune AI algorithms based on performance data
- Implement demand response participation
- Generate EPA Energy Star benchmarking reports
- Document energy savings for commissioners
Enterprise Rollout
- Expand to remaining buildings
- Implement energy performance contracts (EPCs)
- Apply for EPA Energy Star certification
- Publish annual energy report to community
Ready to Transform Your Civic Buildings?
Join counties achieving 25-40% energy reduction through IoT monitoring, AI analytics, and predictive maintenance.
FAQ
Counties see 5-10% immediate savings within 30 days from no-cost operational improvements like fixing HVAC schedules and replacing dirty filters.
Additional 8-12% savings manifest within 60-90 days as predictive maintenance prevents efficiency degradation and AI algorithms optimize setpoints.
Full 20-35% savings realizes within 6-12 months as comprehensive IoT monitoring covers all major equipment.
Temperature/humidity sensors ($50-100 each) provide foundation for occupancy-based scheduling and setpoint optimization.
Power monitoring on major HVAC equipment ($300-800 per circuit) tracks energy consumption enabling efficiency trending.
Chiller/boiler performance sensors ($500-1500 per unit) predict failures weeks early during peak seasons.
Combined investment: $8K-15K per building generates $25K-60K annual savings.
IoT sensors continuously monitor chiller refrigerant pressures, compressor amp draw, temperature differentials, and vibration patterns.
When parameters drift—refrigerant pressure dropping, compressor current increasing—predictive alerts trigger 2-3 weeks before catastrophic failure.
This enables scheduled repairs during moderate weather rather than emergency service during heat waves when contractors charge premium rates.
Yes—while each building type requires tailored strategies, core principles apply universally.
Courthouses: Schedule-based conditioning aligning with court dockets
Libraries: Zone-level control separating computer labs from reading areas
Community centers: Event-driven scheduling
Admin buildings: Aggressive night/weekend setback
Typical portfolios achieve 20-35% overall energy reduction despite building diversity.
EPA Energy Star: Monthly utility bill entry and building characteristics for benchmarking
State energy offices: Annual reports with Measurement & Verification data
Utility incentives: Pre/post installation documentation with equipment specifications
Internal audits: Preventive maintenance logs, work order completion rates
CMMS platforms automate this documentation: utility tracking feeds Portfolio Manager, work orders capture details, dashboards export state-required reports.