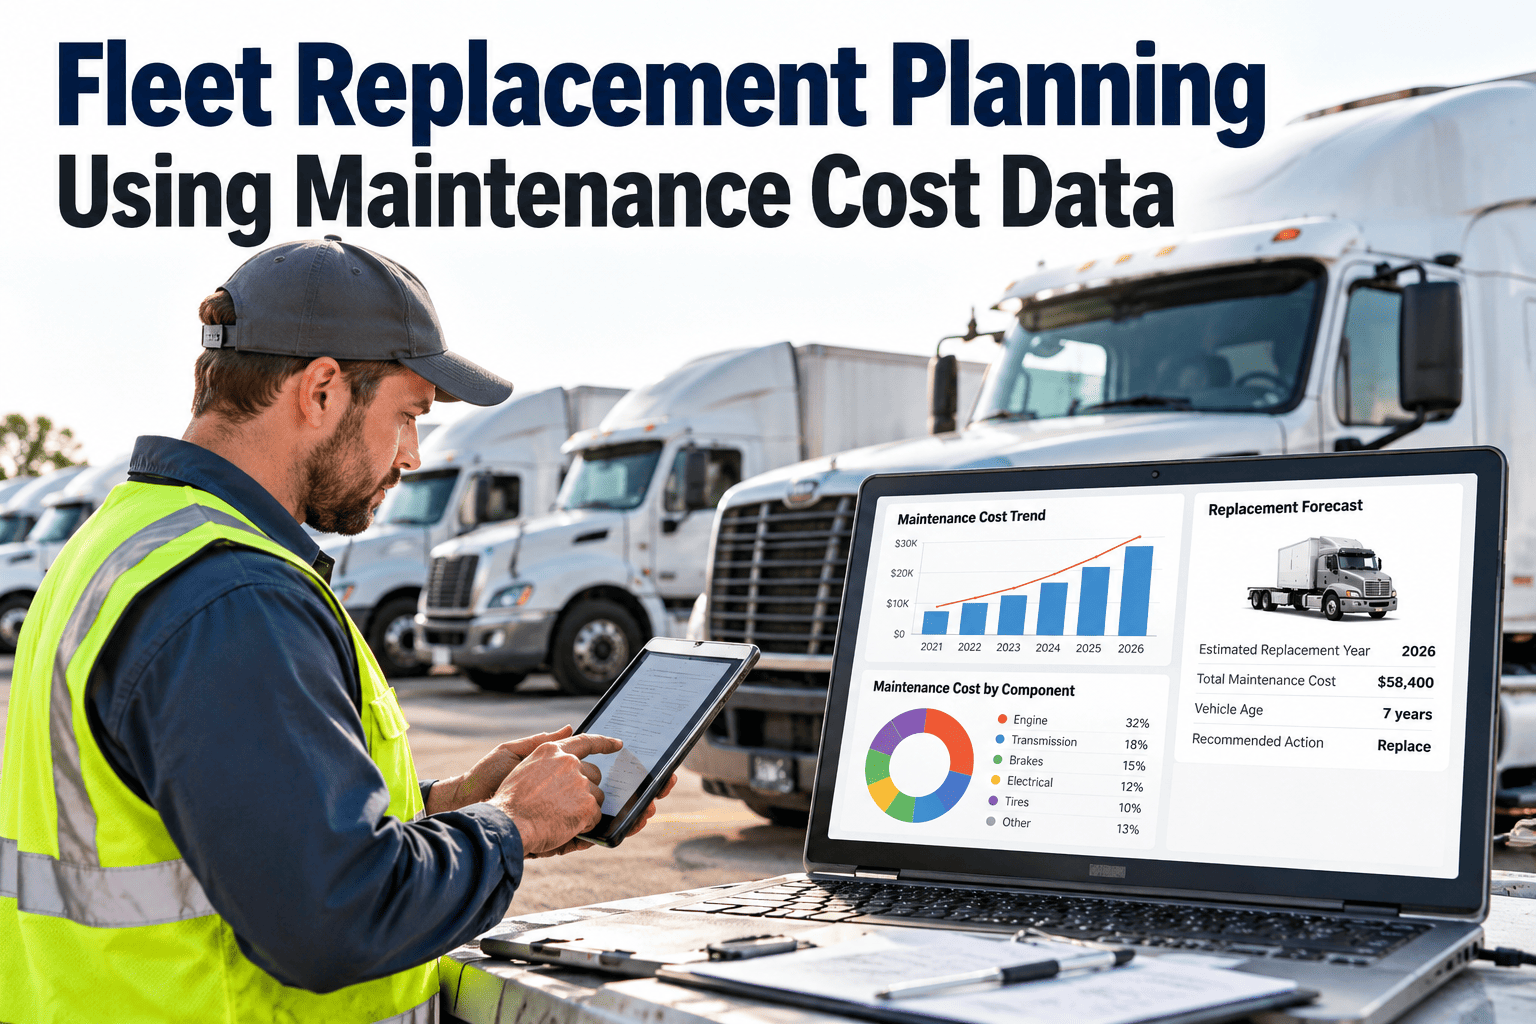
Fleet replacement planning is hard because every vehicle looks fine on the lot and expensive in the shop. Many municipal fleets still retire units on a fixed age or mileage rule, then argue each exception at budget time with little more than a feeling that the truck is always broken. The maintenance record holds a better answer. Repair history, downtime, repeat failures and parts spend show when a vehicle stops earning its place, and resale value shows what waiting will cost. This guide explains how to find the economic replacement point for each unit, build a defensible scorecard and present the case to finance. If you want the records in one place first, you can organize your fleet history in a CMMS before the next budget cycle.
Fleet Replacement Planning Using Maintenance Cost Data
Replace the right vehicles at the right time by comparing repair cost, downtime and resale value against the cost of owning a newer unit.
Why calendar rules misfire
Age-and-mileage rules
- Replace everything at the same age, so healthy units leave early
- Unreliable units survive until the cutoff and drain the repair budget
- Exceptions are argued by anecdote at each budget hearing
- Downtime is felt by crews but never priced
Cost-data decisions
- Each unit is judged on its own repair, downtime and resale record
- Candidates are flagged months before the budget is written
- Council sees the evidence behind every request
- Age and mileage still matter, as inputs rather than verdicts
What drives the shape of the cost curve
Total ownership cost has parts that fall as a vehicle ages and parts that climb. The economic life sits where their combined yearly cost is lowest.
Costs that fall per year
- Purchase price spread over more years
- Depreciation, which is steepest early on
- Financing or capital charges, where they apply
Costs that rise per year
- Repairs and parts, especially major components
- Downtime and substitute vehicle costs
- Fuel and efficiency loss on older engines
- Obsolescence and parts lead times
The data you need for each vehicle
| Data point | Where it comes from | Why it matters |
|---|---|---|
| Purchase price and in-service date | Procurement and asset records | Sets the baseline for annualized cost |
| Odometer or engine hours | Meter readings on work orders | Measures use, not just age |
| Repair and PM cost by year | Closed work orders with labor and parts | Shows the repair cost trend |
| Downtime days | Work order open and close times | Reveals lost service and rental cost |
| Repeat failures | Repair history by asset and system | Signals a unit that cannot be fixed economically |
| Fuel use | Fuel records | Captures efficiency loss |
| Expected resale or salvage | Auction results for similar units | Shows what waiting costs in lost value |
Build a replacement scorecard
No single number decides a replacement. Score each unit on several signals, and set thresholds from your own fleet history by vehicle class.
Repair cost per mile or hour
Flag units that run well above their class average for a sustained period.
Downtime days per year
Count days out of service, with an estimated cost for substitute vehicles and idle crews.
Repeat failures
Look for the same system failing again after repair, which suggests deeper wear.
Single large repair against value
Some agencies flag a repair that approaches half of the vehicle’s value. Treat it as a prompt for review, not an automatic decision.
Safety and inspection defects
Rising defect counts on brakes, frames or lifting gear can outweigh a favorable cost figure.
Parts availability and lead time
Long waits for older models extend downtime and push repair cost higher.
Worked example: keep or replace
The numbers below are illustrative and ignore financing and fuel differences. Use your own prices, resale estimates and costs.
Keep the current unit
Replace with a new unit
Put every repair, meter reading and downtime day in one record
Oxmaint helps fleet teams track work orders, preventive maintenance, parts and cost history by vehicle, so replacement decisions rest on records instead of recollection.
Repair, keep, reassign or replace
Keep and monitor
Continue preventive maintenance and review yearly.
Plan replacement
Put it on the next capital list and arrange a spare if needed.
Reassign
Move to light-duty or standby work to extend useful life.
Repair selectively or retire
Limit spending to safety items and compare with disposal value.
A six-step planning workflow
Clean the records
Fix duplicates, link every work order to a vehicle and record meters.
Group by class
Compare like with like, such as pickups, dump trucks and sweepers.
Score each unit
Apply the scorecard and flag units over your thresholds.
Test the numbers
Run keep and replace costs for flagged units over the same period.
Rank and phase
Spread replacements across years to avoid a single large purchase.
Review results
Compare actual resale and new-unit costs to forecasts and adjust.
Vehicle types that need their own rules
Street sweepers
High capital cost and heavy engine-hour use make hours, repair trend and missed routes more useful than age alone.
Snow and ice equipment
Seasonal use means low mileage but hard duty. Track hours, corrosion and hydraulic repairs.
Emergency apparatus
Safety standards and availability requirements may override pure cost logic. Confirm with local rules.
Electric vehicles
Battery health, charging infrastructure and different repair patterns need separate tracking.
Present the plan so finance can approve it
- Lead with the decision. State how many units, which classes and the total request for each year.
- Show the trend. Use a simple chart of yearly cost per unit, with the flagged vehicle highlighted.
- Show the alternative. Compare the cost of keeping each flagged unit another year with the cost of replacing it.
- Phase the spending. Offer a schedule that levels purchases across budget years.
- Attach the evidence. Keep work order history, downtime and inspection findings ready for questions.
- Report back. Follow up with actual savings so the next request is easier to approve.
How a CMMS supports replacement decisions
Clean the fleet baseline before you analyze
Replacement analysis is only as good as the records behind it. These cleanup tasks usually pay for themselves in the first budget cycle.
One record per vehicle
Remove duplicates, give each unit a unique identifier and confirm VIN or serial number.
Link every work order
Make the vehicle a required field so repair cost cannot land in a general account.
Capture meter readings
Record odometer or engine hours on each service visit so cost per mile or hour can be calculated.
Separate PM from repair
Code preventive and corrective work differently so the repair trend is not hidden.
Record outside repairs
Enter vendor invoices against the vehicle so dealer and contractor work is counted.
Log out-of-service time
Use the open and close time of each repair to calculate days of downtime.
Utilization changes the answer
Two vehicles of the same age can deserve different decisions. Compare usage with the class norm before choosing.
Low-use vehicles
- Age may drive deterioration more than mileage
- Consider sharing or pooling before buying a new unit
- Check whether the role still needs a dedicated vehicle
- Watch for seals, tires and corrosion issues
High-use vehicles
- Wear can outrun the age-based schedule
- Compare cost per mile or hour to the class average
- Consider rotating with a lighter-duty assignment
- Plan the replacement earlier and stage the purchase
Time the sale as carefully as the purchase
Resale value is part of the replacement equation, and it can fall faster than expected when a vehicle needs major repairs.
Habits that protect resale value
- Keep complete service records for every unit
- Avoid deferring repairs that affect condition
- Record cosmetic and body damage promptly
- Compare auction results to your forecast each year
Habits that erode it
- Running vehicles until major failures occur
- Selling without service documentation
- Delaying disposal until units become unsellable
- Using one flat resale rate for every vehicle class
Funding and phasing options to discuss with finance
The best replacement date is not always the date money is available. Ask finance which options are open to your agency and how each affects the operating budget.
| Approach | When it fits | Watch for |
|---|---|---|
| Annual capital budget | Steady, predictable replacement needs | Large peaks when many units age out together |
| Replacement reserve fund | Agencies that can set aside money each year per vehicle | Reserve targets that ignore price increases |
| Lease or financing | When spreading cost avoids budget spikes | Total cost over the term and end-of-lease terms |
| Grants and programs | Vehicles that meet funding program goals | Application timelines and matching requirements |
| Phased purchases | Backlog of older units that cannot all be replaced at once | Keeping the worst units from slipping to the end |
Signs a vehicle may be past its economic life
- Repair cost keeps climbing. Each year costs more than the last, with no sign of leveling off.
- Downtime is now routine. Crews plan around the vehicle being unavailable.
- Repairs repeat. The same system fails again within a short time.
- Parts are hard to get. Long waits or special orders extend each repair.
- Safety findings increase. Inspections note frame, brake or lifting problems more often.
- Resale value is falling quickly. Waiting another year costs more than the savings from deferring.
Mistakes that undermine replacement plans
A quarterly fleet review agenda
A short, regular meeting keeps replacement planning from becoming a once-a-year scramble.
Flagged units
Review vehicles that crossed a scorecard threshold since the last meeting.
Cost trends
Look at repair cost per mile or hour by class and note any sudden changes.
Downtime
Review days out of service, who was affected and what substitutes were used.
Upcoming orders
Check lead times for approved purchases and the status of outgoing units.
Disposal
Plan the sale of retired vehicles and compare results with the resale forecast.
Decisions
Record what was decided, who owns it and what data must be updated.
Questions elected officials and finance often ask
Frequently asked questions
What is the economic replacement point of a vehicle?
It is the age or usage level where the yearly cost of keeping a vehicle, including repairs and downtime, starts to exceed the yearly cost of owning a replacement.
Is there a standard replacement age for municipal vehicles?
No single age fits every class and duty cycle. Use age as a starting reference and let cost, downtime and condition data decide for each unit.
What data should I collect first?
Start with purchase price, meter readings, repair cost by year and downtime days. A CMMS can capture these automatically from work orders.
Does maintenance software help with fleet budgeting?
Yes. Cost history by vehicle supports capital requests and phased plans. To see a fleet example, book a demo with Oxmaint.
How often should replacement plans be reviewed?
Review flagged units quarterly and the full plan once a year before budget preparation, using updated costs and resale results.
Replace vehicles on evidence, not on habit
Track repair cost, downtime and history for every unit and bring clear numbers to the budget table. Oxmaint helps fleet teams keep the records that replacement plans depend on.