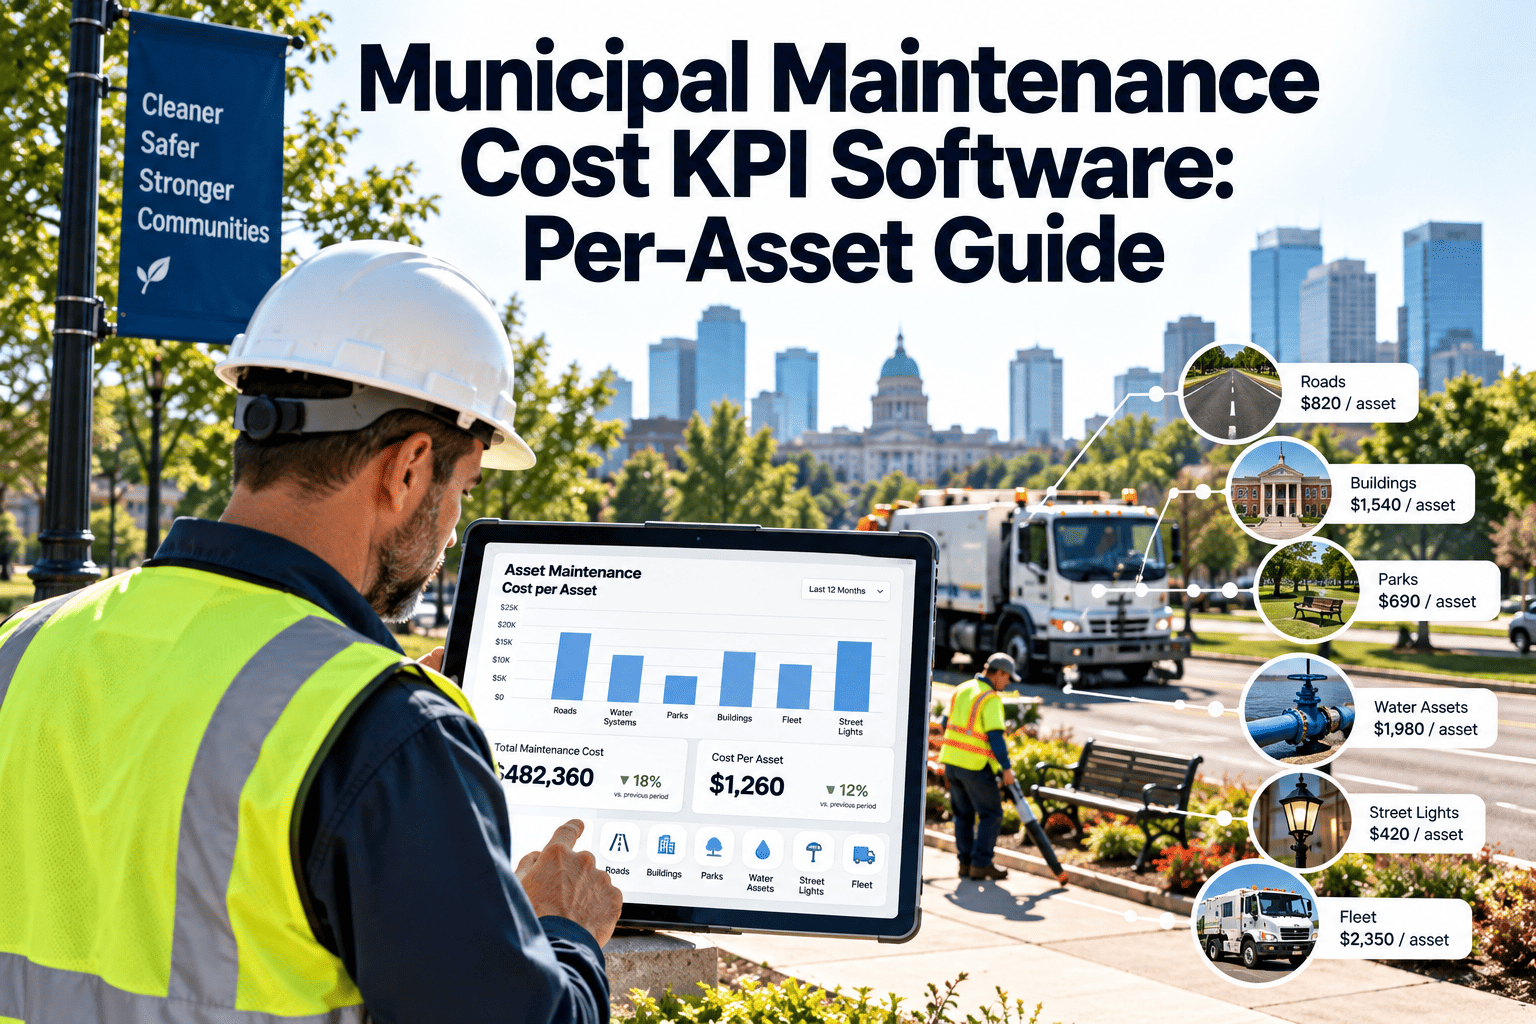
Every municipal budget hearing eventually lands on the same line item, and the department that can answer "what does it cost to maintain this" with a number broken down by asset, building, or lane-mile walks out of that hearing in a very different position than the one that answers with an estimate. Cost-per-asset KPIs turn a single lump maintenance budget into a set of comparable, defensible figures — cost per square foot of facility, cost per lane-mile of street, cost per vehicle in the fleet — that hold up against peer cities and prior years alike. Getting there requires labor hours, parts, and contractor invoices to roll up automatically against the asset that generated them, rather than a manual export built once a year. Get Started to see how work order data becomes a per-asset cost dashboard.
If council asked what it costs to maintain one lane-mile of street, could you answer in the room?
Cost-per-asset KPIs turn a single line-item budget into figures a council member, a peer city, or an auditor can actually compare — down to the building, the vehicle, or the lane-mile.
A total maintenance budget hides more than it reveals
"We spent $4.2M on maintenance this year" tells a council almost nothing about whether that spend was well directed. Normalizing cost against the asset it was spent on — square footage, lane-miles, vehicle count, or unit count — is what makes a maintenance budget legible to people outside the department.
Cost per square foot
Total facility maintenance spend divided by managed square footage. National medians typically sit in the low single dollars per square foot, with meaningful variation by building age and use type.
Cost per lane-mile
Total street maintenance spend divided by lane-miles maintained. This figure should be tracked separately for preventive treatments and full reconstruction, since the two differ by an order of magnitude in cost.
Cost per vehicle
Total fleet maintenance spend divided by managed vehicle count, best tracked alongside downtime and age to distinguish a well-managed older fleet from a genuinely underfunded one.
Cost per work order
Average total cost per closed work order, a useful check on whether reactive work is quietly consuming a disproportionate share of the budget compared to planned maintenance.
How a cost-per-asset figure actually gets built
The formula itself is simple. What makes it defensible is consistency: the same cost inputs, the same asset denominator, and the same time period, applied the same way every reporting cycle.
Labor hours at loaded rate, plus parts and materials, plus contractor invoices, all tied to the asset's work orders for the period.
Managed square footage, lane-miles, vehicle count, or unit count for that same asset category and period.
A per-unit cost figure that can be tracked quarter over quarter and compared against peer cities using the same definition.
The most common way this breaks down is inconsistent definitions — one department counting overtime differently than another, or "square footage managed" quietly shrinking when a leased building is dropped from the count without anyone flagging it.
What a wide cost range on the same asset type usually means
Pavement maintenance is the clearest example of why a single "cost per lane-mile" number without context can mislead. Treatment cost scales sharply with how far a road has already deteriorated before work begins.
Ranges are illustrative industry figures for preservation and reconstruction treatments and vary by region, material, and traffic loading — the point a cost-per-lane-mile KPI should surface is which category your spend is falling into over time, not just the total dollar figure.
What to have ready before the budget hearing
Cost-per-asset figures for facilities, streets, and fleet, each with a consistent definition documented alongside the number.
A trend line showing the last three to five years, not just the current-year snapshot.
A reactive-versus-planned spend split, since a rising reactive share usually explains a rising cost-per-asset figure.
A deferred maintenance backlog figure to pair with the current spend rate, so the number reflects the full picture, not just this year's activity.
Peer city comparisons where available, with the comparison's data source and normalization method noted.
From a lump budget line to a defensible per-asset record
- One total maintenance figure presented at budget season
- No consistent way to compare this year against last year by asset type
- Reactive versus planned spend split estimated, not measured
- Peer city comparisons assembled manually, if attempted at all
- Cost drivers behind a budget increase explained anecdotally
- Cost per square foot, per lane-mile, and per vehicle tracked continuously
- Year-over-year trend available at any point, not just at budget season
- Reactive versus planned spend split calculated directly from work orders
- Peer comparisons built on a documented, repeatable normalization method
- Cost drivers traceable to specific assets and work order history
Stop estimating your cost per asset. Start reporting it.
Roll up labor, parts, and contractor spend against every facility, street segment, and vehicle automatically, and walk into budget season with the numbers already built.
Municipal maintenance cost KPIs, answered
What's a reasonable cost-per-square-foot target for municipal facilities?
Published benchmarks vary by building age, use type, and region, so a fixed universal target is misleading. The more useful practice is tracking your own trend over time and comparing against peer cities using the same normalization method.
Should preventive and reactive street spend be reported separately?
Yes. Blending crack sealing costs with full reconstruction costs into a single cost-per-lane-mile figure obscures whether the network is being preserved or is quietly sliding toward more expensive reconstruction work.
How do we compare our costs against other cities fairly?
Use a shared source of standardized definitions, such as APWA or GFOA benchmarking frameworks, and confirm the peer cities being compared use the same asset counting method you do before drawing conclusions from the gap.
Can a CMMS calculate these KPIs automatically?
Yes, when labor, parts, and contractor costs are logged against work orders tied to a specific asset record, the per-unit cost rolls up without a separate finance export. Book a Demo to see a live cost dashboard.
What causes cost-per-asset figures to look worse even when maintenance is improving?
A common cause is finally logging deferred backlog work that was previously untracked, which raises the reported figure even as the underlying asset condition improves. Pairing the cost trend with a condition trend prevents this from being misread.
Every dollar spent on an asset should be traceable back to that asset
Build cost-per-square-foot, cost-per-lane-mile, and cost-per-vehicle KPIs directly from your work order history.