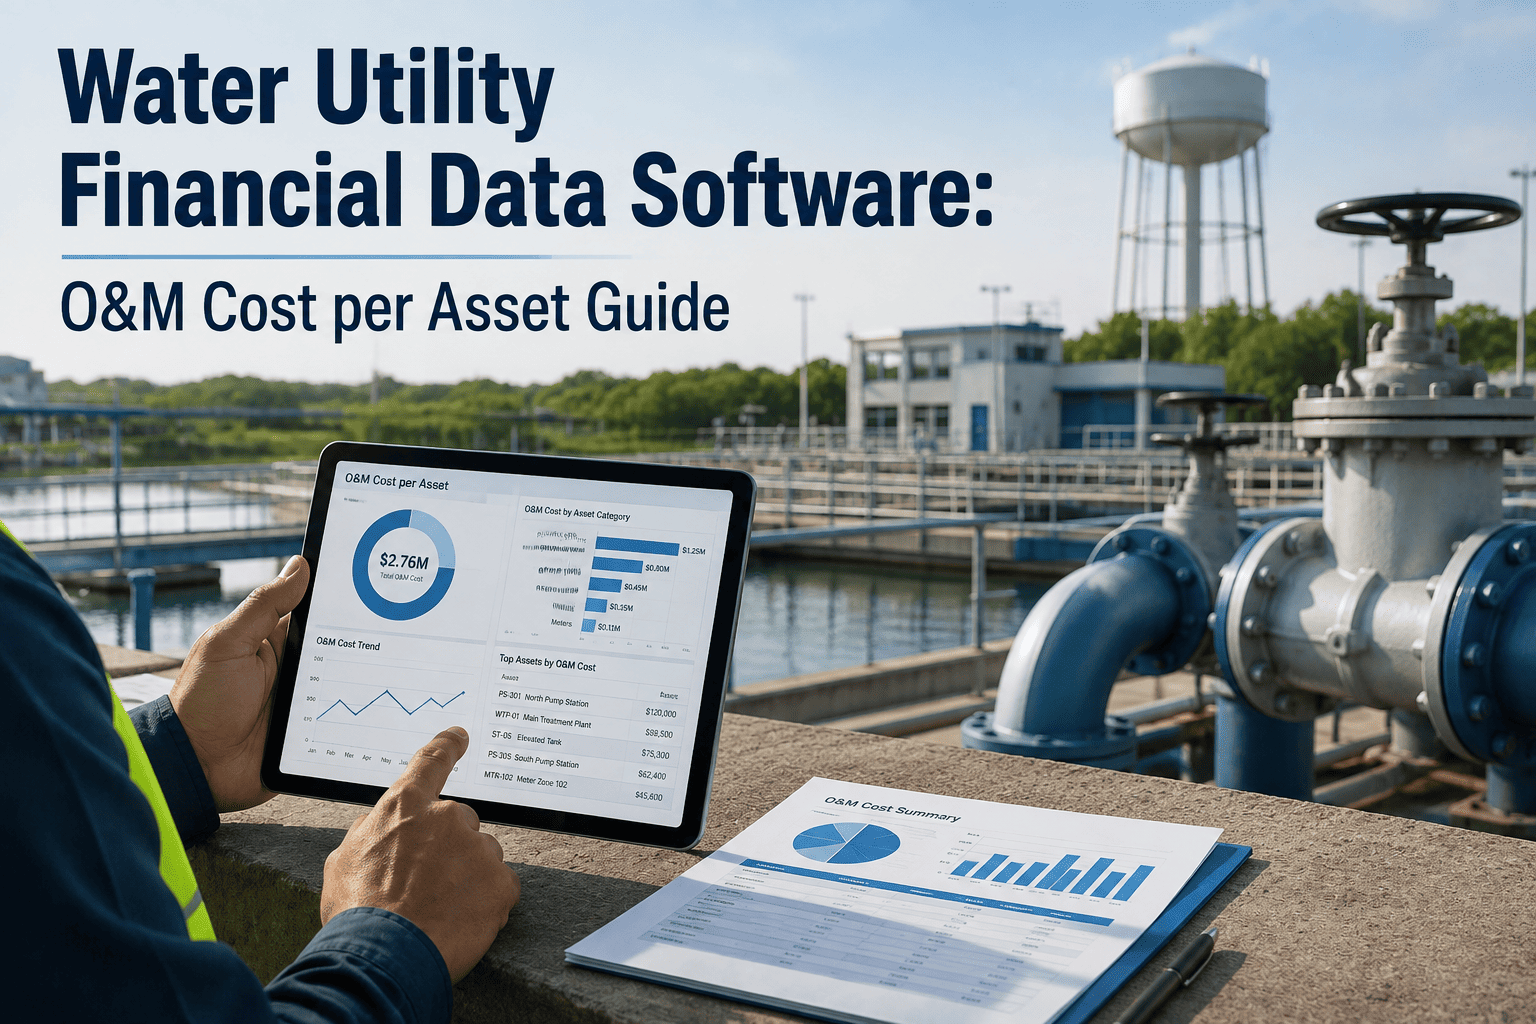
Every water and wastewater utility can tell you its total annual O&M budget. Almost none can tell you, on demand, what it actually costs to operate and maintain a single lift station, a specific well, or one mile of distribution main. That gap is not a bookkeeping detail — it is the reason rate cases stall, capital requests get cut, and commissioners ask questions finance teams cannot answer from a spreadsheet. Utilities that can produce O&M cost per asset, per system, and per service population walk into a rate hearing with documented evidence instead of rough estimates. This guide breaks down what that financial discipline actually requires and how a connected CMMS builds it automatically in the background, without a separate reporting project or a dedicated analyst. Sign up free to see your own asset-level cost data start forming from day one.
Stop Guessing What Each Asset Actually Costs to Run
Oxmaint turns routine maintenance and operations activity into structured financial data — O&M cost per asset, per system, and per service population — ready for budgets, audits, and rate cases.
Your General Ledger Knows the Total. It Doesn't Know the Why.
A finance system can tell a utility that chemical, labor, and contractor spend added up to a certain number last year. It cannot tell anyone which lift station drove that number, whether a specific well's pump has become a chronic cost sink, or how much one neighborhood's aging main network is quietly costing in emergency repairs. That detail lives in work orders, technician hours, and parts consumption — data that sits in a CMMS, not a chart of accounts. Finance teams end up with a single, undifferentiated O&M number every budget cycle, and operations teams end up unable to prove which assets actually deserve the next capital dollar. Both sides are working from the same underlying activity, just recorded in two systems that were never designed to talk to each other.
This is why so many utilities still answer budget and rate questions with judgment calls dressed up as numbers. A superintendent knows, from memory, that a particular lift station has been a headache for years. That instinct is usually correct — but instinct does not hold up when a rate consultant or a commissioner asks for the dollar figure and the timeline behind it. The utilities that win those conversations are the ones that replaced memory with a running ledger of cost tied to each asset, built automatically as work happens rather than reconstructed under deadline pressure.
O&M Cost Per Asset Is Simpler Than It Sounds
O&M cost per asset is the sum of every labor hour, part, contractor invoice, and consumable tied to keeping one specific piece of infrastructure running for a period of time — divided against what that asset delivers, whether that is million gallons treated, service connections supported, or linear feet maintained. It is not a new metric utilities have to invent. It is a number that already exists inside every work order; it simply needs a system that rolls it up correctly instead of letting it disappear into a department-level total.
The reason this feels hard in practice is not the math, it's the data capture. A technician who replaces a bearing on a specific blower already knows the parts used and the hours spent — the work order captures both. What usually goes missing is the link back to that exact blower's running cost history, and the discipline to close every job against an asset record instead of a generic maintenance category. Once that link exists, the arithmetic behind cost per asset happens automatically every time a work order closes, with no separate reporting exercise required.
The Same Data Answers Four Different Questions
Rate cases are the most visible reason to build asset-level financial data, but they are rarely the only reason a utility needs it. The same underlying numbers answer questions that come up every month, not just once every few years.
From a Single Pump to the Whole Service Area
Financial data only becomes useful when it can move between three levels without anyone re-entering anything. Oxmaint structures cost data so each level rolls up cleanly into the next, and a number pulled for a board meeting always matches the number a technician would find by drilling back down to the original work order.
Turn This Quarter's Work Orders Into Rate-Case-Ready Financial Data
Oxmaint connects labor time, parts consumption, and contractor invoices to each asset automatically, so the cost roll-up is already built by the time finance needs it.
What Changes When Cost Data Is Structured, Not Reconstructed
Most utilities already attempt some version of asset-level cost tracking, usually in a spreadsheet someone maintains alongside their regular job. The table below shows where that approach tends to break down compared to a system where the cost record is a byproduct of doing the work itself, not a separate task layered on top of an already full workload.
| Dimension | Spreadsheet Tracking | Connected CMMS |
|---|---|---|
| Labor Cost Capture | Estimated after the fact from timesheets | Logged against the asset at the moment work is closed |
| Parts & Inventory | Tracked separately from the job that used them | Consumed directly from the linked work order |
| Roll-Up to System Level | Manual re-tagging, prone to inconsistent categories | Automatic, based on asset hierarchy already in place |
| Audit Trail | Difficult to reconstruct months later | Timestamped and attributable to a specific record |
| Rate Case Readiness | A special project every time a filing is due | A standing report pulled on demand |
The Practical Payoff of Asset-Level Financial Data
None of this is about producing a prettier report. It changes the actual conversations a utility has with its board, its regulators, and its own operations team, replacing recurring arguments about spend with a shared, agreed-upon record everyone can check.
Three Habits That Quietly Sink Financial Data Quality
Utilities rarely lack the will to track cost by asset. They lack a workflow that makes it the path of least resistance. These are the habits that most commonly undo an otherwise good asset registry, even at utilities that clearly understand why the data matters.
A Realistic Path From Scattered Records to a Defensible Filing
None of this requires a multi-year overhaul. Utilities that make this shift generally move through the same three stages, and each stage produces useful data on its own before the next one begins.
Water Utility Financial Data Software — Common Questions
No. A CMMS sits alongside your existing finance and billing systems rather than replacing them, capturing the maintenance-side detail those systems were never built to track. It exports summary figures into your existing budget and finance workflow rather than asking finance staff to learn a new platform. Sign up to see how Oxmaint fits alongside what you already run.
Once the asset registry is loaded and technicians start closing work orders against it, cost data begins accumulating immediately rather than after a lengthy setup project. Book a demo to see a realistic timeline for your utility's size.
Yes, asset-level and system-level cost data is exactly the kind of evidence rate consultants and commissions ask utilities to produce during a filing. Start a free trial to begin building that evidence base now, ahead of your next filing cycle.
That is the normal starting point for most utilities, and the fix is procedural, not technical — technicians simply close each work order against the specific asset instead of a general department code. Once that habit is in place, labor cost begins flowing to the asset level automatically, with no retroactive cleanup required. Book a demo to see how that workflow looks in practice.
Yes, the same asset-to-cost structure applies whether a utility has five staff or five hundred, since the value comes from consistent data capture rather than headcount. Sign up to start with the assets that matter most to your budget first.
The Next Rate Case Will Ask for Cost Detail You Can't Produce From a Spreadsheet.
Oxmaint turns everyday maintenance activity into standing O&M cost data — per asset, per system, per service population — so it's ready whenever finance, auditors, or commissioners ask. The utilities that walk into a rate hearing prepared are the ones that started building this record before the filing was due, not after.