Public sector fleets do not have the luxury of hidden waste. Every idle hour, every unplanned breakdown, and every gallon of fuel is paid for by taxpayers, tracked in a public budget, and questioned at council review. Telematics turns opaque fleet operations into a defensible, data-backed record, which is why roughly 70% of public fleets have already deployed some form of it. The gap now is not adoption, it is implementation done well enough to actually change decisions. That is the difference between telematics as a compliance checkbox and telematics that funds itself in year one, and it starts with a free trial or a quick demo.
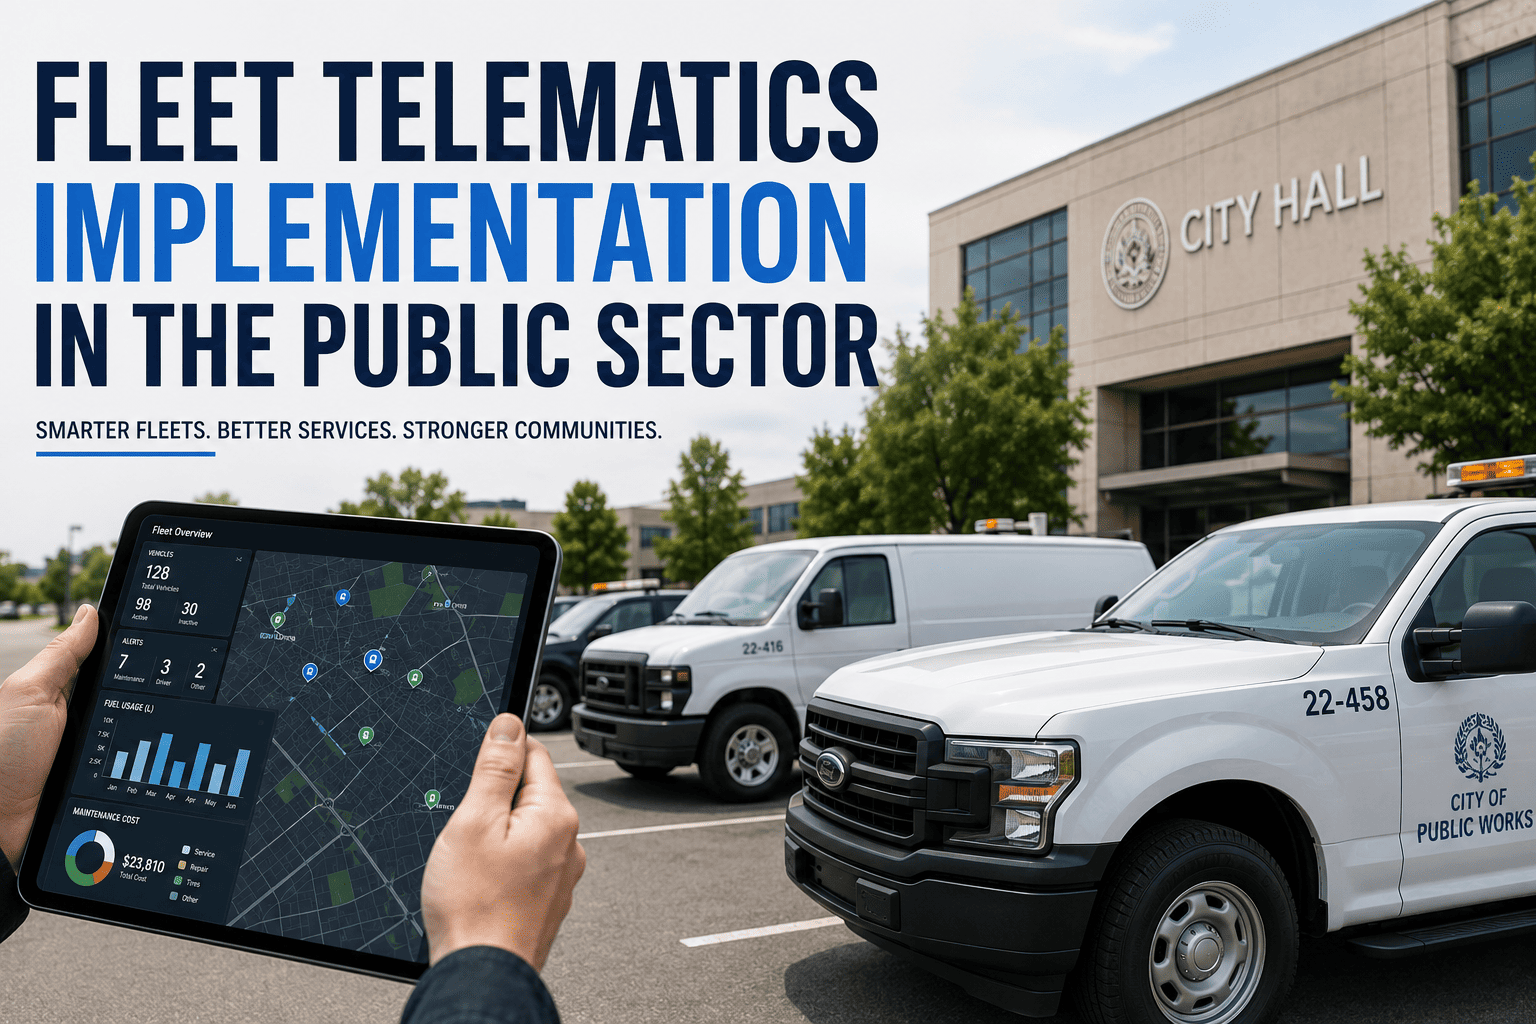
Fleet Telematics Implementation in the Public Sector
Telematics turns fleet data into accountability, safety, and savings. Here is how public agencies move from GPS dots on a map to a rollout that stands up in a budget review, cuts fuel and accidents, and pays for itself.
Four Public Fleets, One Telematics Playbook
Every public agency runs vehicles, but the pressure on those vehicles is different. Telematics rollouts land fastest where the pain is loudest, and in the public sector that pain sits in four operational corners. Each one uses the same data feed, but reads it through a different lens.
The largest share of public sector vehicles on the road and the biggest source of auto-related losses. Telematics attaches every trip to a job, cuts unaccounted mileage, and proves service completion.
Telematics improves response time, cuts preventable accidents, and documents hot-pursuit policy through speed, siren, and light activation data, protecting officers and the agency in one record.
Route adherence, dwell time, and driver behavior turn into service-quality data. Combined with cameras, telematics has been linked to sustained double-digit year-over-year loss reduction on transit fleets.
Near-universal telematics on school buses now, with the biggest safety gains coming on the staff-driven white-fleet vehicles, which historically ran with the least oversight and the highest incident cost.
The Public Sector Implementation Roadmap
A public sector telematics rollout is not a hardware install, it is a procurement, security, and change-management project with hardware in the middle of it. Skipping any of these phases is why so many pilots stall between the RFP and the dashboard. Here is the five-phase path that actually finishes.
Inventory the fleet across every department, capture 90 days of fuel, accident, and downtime data on paper first. Without a baseline, savings claims are indefensible in a council or auditor review.
Run the RFP through the cooperative or framework contract available to your agency, confirm FedRAMP and FIPS-level data security, and secure legal sign-off on driver-data policy before any device is ordered.
Install on one operationally critical department first, public works or transit is the standard choice. Prove savings on a controlled sample so the full-fleet rollout is defended by data, not slides.
Scale department by department, integrate the telematics feed with the maintenance system, and set the KPI dashboards that fleet, finance, and department heads will actually check each week.
Move from location data to decisions, right-size the fleet using utilization data, tie maintenance schedules to engine hours, and publish a quarterly savings report that keeps the program funded.
Skip The Common Rollout Mistakes
Oxmaint plugs into every major telematics provider, brings your utilization, idle, and PM data into one dashboard, and gives fleet, finance, and department leaders the same defensible view. That means a pilot that produces evidence, a rollout that survives budget season, and a report that keeps the program funded year after year.
Six Metrics The Council Will Actually Ask About
Public sector telematics is not judged on the number of devices installed, it is judged on the numbers the finance office can defend. These six metrics translate telematics data into the language of a budget hearing, a citizen inquiry, or a compliance audit. They are the reason a program keeps its funding.
Total cost of ownership divided by miles driven, per vehicle. Rolls fuel, maintenance, insurance, and depreciation into one number that exposes which units are quietly bleeding the budget.
Active hours divided by available hours, per unit. Below 60% means surplus capacity in the lot, and each idle assigned vehicle still carries five to seven thousand dollars a year in fixed cost.
Idle hours split from drive hours per vehicle. Target five percent or lower. Every ten percent of idle time costs roughly one percent of fuel economy, and it compounds fleet-wide fast.
Percentage of scheduled preventive services completed on time. Fleets running above 90% PM compliance run at materially lower cost per mile because planned service is a fraction of reactive repair.
A composite of harsh braking, speeding, cornering, and phone use, per driver. It anchors coaching, defends the agency against fraudulent claims, and drives measurable accident reductions.
Grams of CO2 per mile per vehicle and per department. It is the number that satisfies ZEV mandates, reports to citizens, and identifies which routes justify the next round of EV replacements.
What Blocks A Public Sector Rollout, And What Fixes It
Public sector telematics fails in predictable places. Every stalled project usually hits at least one of these five walls, and every successful rollout has a specific answer to each. Here is how the two sides line up when the pilot moves into a full deployment.
Police, public works, and transit each run their own systems. There is no fleetwide number to bring to the council, and every request pulls three teams into a spreadsheet exercise.
Telematics feeds from every department pipe into one platform so utilization, cost per mile, and PM compliance are visible fleetwide and per-department, from the same source of truth.
Public procurement, data privacy, and vendor security review can add months to a rollout. Programs stall between selection and deployment while legal and IT sign off in parallel.
Buying through an established cooperative framework and selecting FedRAMP-authorized and FIPS-validated providers shortens the security review and gives legal a defensible starting position.
Ten-plus-year assets cost roughly 35% more per mile than newer units, but they also complicate a telematics install with older ECMs, mixed connectors, and inconsistent OBD availability.
Combine plug-in devices for older units with embedded OEM telematics for newer vehicles, mapped to one back-end so the fleet manager sees one report regardless of vehicle year.
Location tracking without a clear policy triggers grievances. Programs go dark or devices go missing when employees see telematics as surveillance rather than a safety and evidence tool.
A published data-use policy, driver-facing safety scorecards, and telematics evidence that has cleared drivers on fraudulent claims turn the device from surveillance into an operator asset.
Devices are installed, data is streaming, but there is no auditable savings story. The next budget cycle threatens the program because no one can point to the return in dollar terms.
A pre-deployment baseline plus a standing quarterly report on fuel, accident, and maintenance savings converts telematics from a line item into a self-funding investment the council defends.
What Each Telematics Signal Is Telling A Public Fleet Manager
A telematics dashboard is only as useful as the decisions it drives. Each signal a public fleet manager reads should point to an action a department head, a maintenance planner, or a finance officer can take this week. Here is the read-across from raw signal to public sector move.
| Telematics Signal | What It Reveals | Public Sector Action |
|---|---|---|
| Utilization under 60% | Surplus vehicles by department | Right-size, redeploy, defer replacement purchase |
| Idle time above target | Fuel waste and emissions creep | Apply shutoff policy, coach drivers, install APUs |
| Harsh-brake spike per unit | Driver risk or route hazard | Coach the driver, review the route, avoid a claim |
| PM compliance under 90% | Maintenance backlog building | Reset schedules to engine hours, add tech capacity |
| Cost per mile drift | An aging asset turning uneconomic | Move unit into the replacement queue this cycle |
| Accident with dashcam | Facts to defend or resolve claim | Submit footage, contest fraudulent claim, close file |
| Emissions per mile rising | ZEV mandate risk on that class | Prioritize class for EV replacement funding |
Compliance, Security, And Accountability In One Platform
A public sector telematics program lives or dies on defensibility. The data has to hold up in a records request, an audit, and a legal review, without extra work from the fleet team. Oxmaint gives you the same telematics feed every department uses, but wrapped in the reporting layer public agencies actually need.
Encrypted at rest and in transit, aligned with the standards public sector security reviews expect, so IT sign-off does not stall the deployment.
Every trip, service event, and inspection tied to one asset record, exportable for records requests, insurance reviews, or council reporting on demand.
Connects to the major public sector telematics providers so a rollout does not force a rip-and-replace, and mixed hardware across departments still lands in one dashboard.
Quarterly fuel, accident, and maintenance savings surfaced in the format a finance director signs off, keeping the program funded through budget cycles.
Ready to move from GPS dots to a rollout that pays for itself? Start a free trial or book a demo and see your baseline data mapped inside the first session.
Frequently Asked Questions
Why do public sector fleets need telematics if 70% already have it?+
How long does a public sector telematics rollout take?+
Does Oxmaint replace our existing telematics provider?+
What return should a public agency expect on telematics?+
How do we defend the program in the next budget review?+
Turn Telematics Data Into A Public Sector Result
A pilot without a baseline is a slide deck. A rollout without a dashboard is a fuel bill. Oxmaint gives public sector fleet managers the utilization, PM compliance, and cost-per-mile reporting that survives a council review, defends a budget line, and pays back the program in year one. See your own fleet mapped inside the first session.