A mid-size city in Texas ran 140 vehicles across six departments. Every department said they needed more. When telematics data was finally pulled, 31 of those vehicles averaged fewer than 200 miles per month — sitting in lots collecting insurance premiums, depreciation, and maintenance cost while contributing nothing to operations. Those 31 vehicles were costing the city roughly $217,000 a year in carrying costs alone. The fix was not buying more vehicles — it was seeing the ones they already had clearly. Public sector fleets across the country carry 20-35% more vehicles than their operational demand requires, and the only reason they persist is the absence of per-vehicle utilization data. If your fleet has never measured which vehicles actually earn their cost, start a free trial with OxMaint to see utilization scoring across your entire fleet, or book a 30-minute demo with our public fleet specialists.
Fleet Utilization Analytics / Right-Sizing Intelligence / Public Sector Optimization
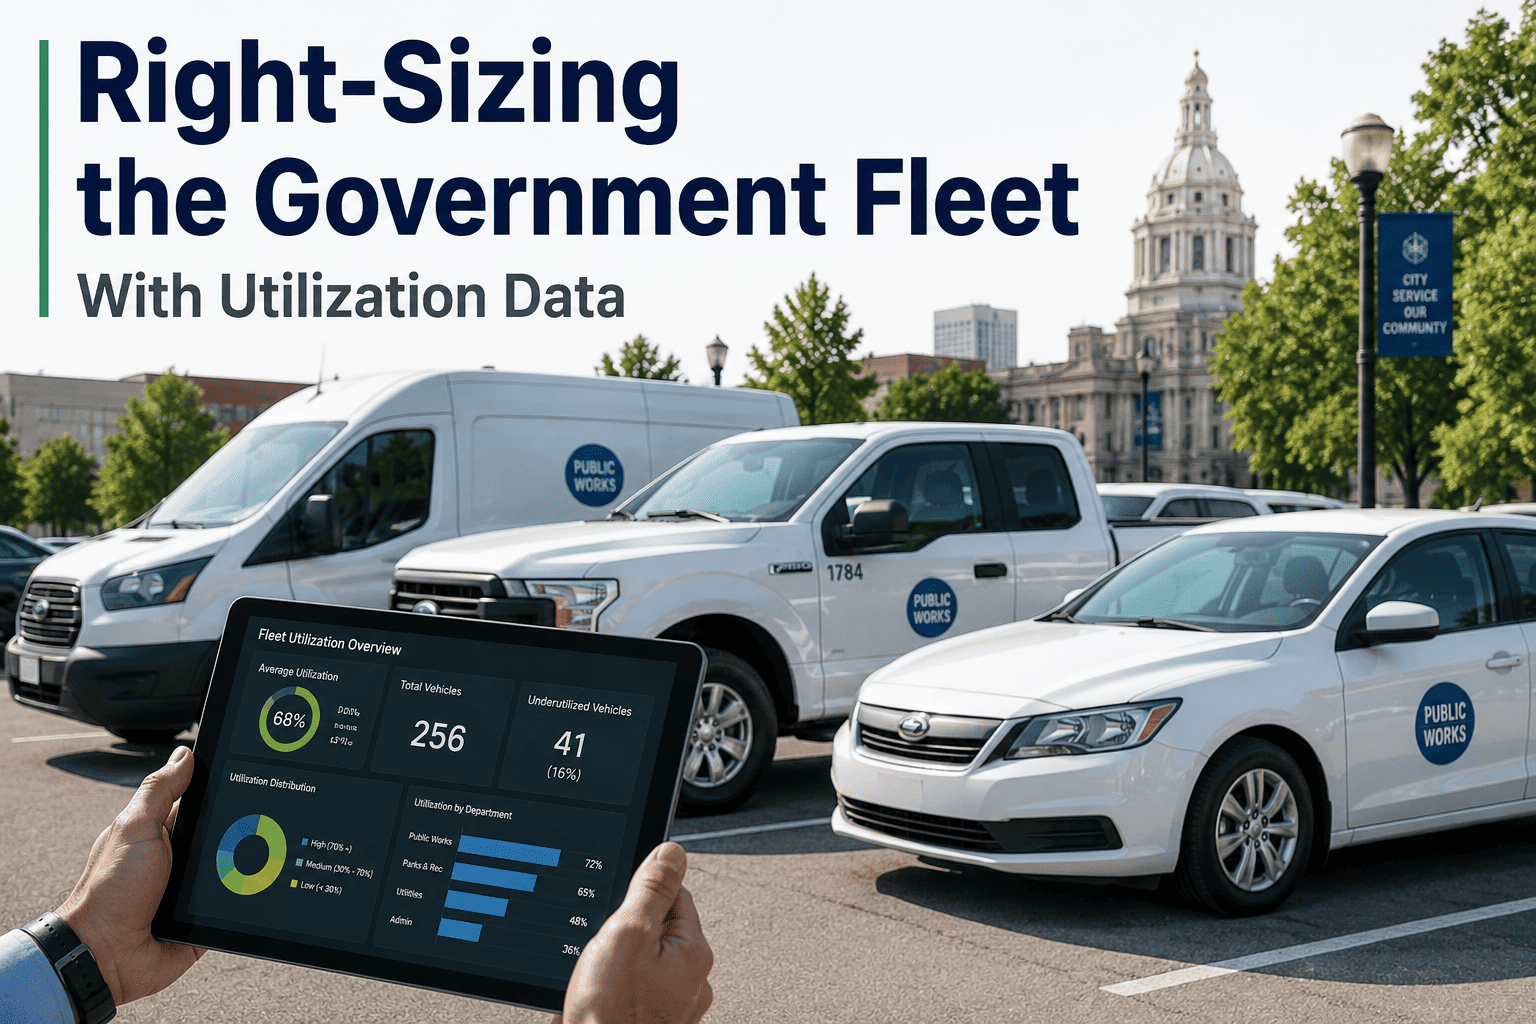
Right-Sizing the Government Fleet: Utilization Data That Shows Exactly Which Vehicles You Can Cut Without Hurting Service
Most public fleets are 20-35% larger than they need to be. OxMaint measures utilization per vehicle, per department, and per location — identifying which assets are earning their cost, which should be reassigned, and which can be removed entirely, with the financial impact calculated for every decision.
20-35%
Excess vehicles in a typical public sector fleet
$6,398
Average annual TCO per government fleet vehicle
10-30%
Fleet reduction achieved by agencies that track utilization consistently
$448
Daily cost of a light-duty vehicle sitting idle
The Utilization Gap: Most Fleets Do Not Know How Much Capacity They Waste
Fleet utilization rate measures how much of your available vehicle capacity is actually being used for productive work. High-performing government fleets target 85-90% utilization. Most public sector fleets operate well below 70% — meaning 30% or more of their vehicle capacity generates cost without generating service. The gap between where your fleet sits and where it should sit is measured in vehicles you do not need and dollars you should not be spending.
Government Fleet Utilization Zones — Where Does Your Fleet Sit?
Critical
Below 55%
Fleet is severely oversized. 25-40% of vehicles are surplus. Immediate right-sizing opportunity with significant budget recovery.
Action: Comprehensive utilization audit needed
Underperforming
55-70%
This is where most government fleets sit. 15-25% excess capacity is common. Pooling, reassignment, and selective disposal will yield measurable savings.
Action: Per-vehicle analysis and pooling strategy
Optimized
70-90%
Fleet is well-aligned with demand. A 5-10% buffer covers peak periods and unplanned downtime. Focus shifts to maintaining utilization and preventing creep.
Action: Monitor and prevent fleet size creep
See Your Fleet's Utilization Score
Find Out Which Vehicles Are Earning Their Cost — and Which Are Just Collecting Insurance Premiums
OxMaint calculates utilization rate per vehicle, per department, and per location from telematics and maintenance data — showing you exactly where surplus capacity sits and how much it costs.
Where Idle Capacity Hides in Government Fleets
Underutilized vehicles do not announce themselves. They sit in lots, pass inspections, and quietly consume budget that could fund maintenance, technology upgrades, or the replacement vehicles your fleet actually needs. These are the four places idle capacity hides most often in public sector operations.
01
Department-Assigned Vehicles That Rarely Move
Every department wants dedicated vehicles. The result is dozens of individually assigned cars and trucks that sit parked 60-80% of the time because the assigned employee only needs a vehicle 2-3 days per week. Each one still carries full insurance, registration, and depreciation cost — $5,000-$7,000 per year per vehicle whether it moves or not.
$5K-$7K/yr
per idle assigned vehicle in carrying costs
02
Peak-Sized Fleets Running at Average Demand
Fleets sized for peak demand (snow season, storm response, summer construction) carry that full capacity year-round. When the peak-to-average demand ratio exceeds 1.3, it means the fleet is sized for conditions that only occur 10-15% of the time — the rest of the year, 20-30% of vehicles sit idle waiting for conditions that may not come for months.
20-30%
of fleet idle when sized for peak-only demand
03
Siloed Departments That Cannot See Each Other's Assets
Public works has three trucks sitting idle while parks is requesting a new vehicle purchase. Without cross-department visibility, surplus capacity in one division is invisible to the shortfall in another. Fleet data fragmented across separate spreadsheets per department makes this the norm — not the exception — in most municipal governments.
Invisible
surplus when departments operate in data silos
04
Wrong Vehicle for the Job — Oversized and Underused
A building inspector driving an F-250 pickup for 15-mile daily rounds when a compact sedan would serve the same function at half the fuel and insurance cost. Right-sizing is not just about fleet size — it is about matching vehicle class to actual job requirements. Oversized vehicles assigned to light-duty roles inflate cost-per-mile and accelerate unnecessary depreciation.
2x
fuel and insurance cost from oversized vehicle assignments
The Right-Sizing Framework: Five Steps From Data to Decision
Right-sizing is not a one-time budget cut — it is an ongoing discipline. Agencies that treat it as a single initiative see results revert within 18 months as fleet size creeps back. The framework below, built into OxMaint's analytics, produces sustained results because it runs continuously on live data rather than a quarterly audit.
Measure: Establish Per-Vehicle Utilization Baseline
Collect 90+ days of per-vehicle data: days in service, miles driven, engine hours, and trip frequency. OxMaint pulls this automatically from telematics or manual entry. The baseline reveals which vehicles work daily and which barely leave the lot — by class, by department, by location.
Timeline: 90 days of data collection for reliable baseline
Analyze: Segment by Class, Location, and Season
A patrol car and a backhoe have different utilization benchmarks. OxMaint segments utilization by vehicle class and location, adjusting for seasonal demand so that a snow plow with low summer utilization is not flagged alongside a sedan that never moves. Context prevents bad decisions.
Benchmarks: Customized per vehicle class and department
Decide: Reassign, Pool, or Dispose
Each underutilized vehicle gets a recommendation: reassign to a higher-demand department, move to a shared motor pool, or flag for disposal with financial impact calculated. The system presents the annual cost saved per action and the resale value recovery window to guide timing.
Output: Prioritized action list with cost impact per vehicle
Present: Generate Board-Ready Utilization Reports
Right-sizing fails when the fleet manager cannot prove the case. OxMaint generates audit-ready reports with per-vehicle utilization trends, cost-per-mile comparisons, and projected savings — documented so finance departments and elected officials can approve reductions with confidence.
Deliverable: Exportable reports for council and budget review
Monitor: Prevent Fleet Size Creep
After right-sizing, continuous monitoring prevents the fleet from growing back. OxMaint flags new vehicle requests against current utilization data — if existing capacity can serve the demand, the system surfaces the evidence before procurement begins. Right-sizing that sticks.
Ongoing: Automated alerts when utilization drops below threshold
Utilization Intelligence Platform
Every Vehicle Scored. Every Department Visible. Every Surplus Dollar Identified.
OxMaint tracks utilization per vehicle and per department from live data — surfacing which assets to keep, reassign, pool, or dispose, with the financial case calculated for each decision.
How OxMaint Identifies Right-Sizing Opportunities Across Your Fleet
OxMaint connects to telematics, maintenance records, and fuel data to build a complete utilization picture of every vehicle in your fleet — scoring each asset, segmenting by department and season, and calculating the budget impact of every right-sizing action. See it working on your asset list — start a free trial or book a demo.
01
Per-Vehicle Utilization Scoring
Every vehicle receives a utilization score based on days in service, miles driven, engine hours, and trip frequency. Vehicles below the class-specific threshold are flagged automatically. Scores update continuously from telematics data — no manual reporting required.
Underutilized vehicles identified within 90 days of deployment
02
Cross-Department Visibility Dashboard
All departments — public works, police, fire, utilities, parks, administration — consolidated into one view. Compare utilization rates across divisions to identify reassignment opportunities where one department's surplus can fill another's shortfall without a single new purchase.
Cross-department reassignment before new procurement
03
Seasonal Demand Adjustment
OxMaint analyzes utilization across 12+ months to distinguish seasonal vehicles (snow plows, mowers) from genuinely underutilized assets. A low-utilization flag in July means nothing for a snow plow — but everything for a sedan that never moves regardless of season.
Seasonal false positives eliminated from right-sizing analysis
04
Motor Pool Transition Modeling
For department-assigned vehicles with low utilization, OxMaint models the impact of converting to a shared motor pool — projecting how many vehicles can be removed while maintaining service levels. Three underutilized dedicated vehicles often become a 2-vehicle pool with no service impact.
Fleet reduction through pooling without service disruption
05
Financial Impact Calculator
Every right-sizing recommendation includes the annual cost saved: insurance, depreciation, maintenance, registration, fuel, and administrative overhead per vehicle removed. Plus the optimal resale timing to maximize recovery before the next depreciation step-down.
$8,000-$15,000 annual savings quantified per removed vehicle
06
New Vehicle Request Validation
When a department requests a new vehicle, OxMaint checks current fleet utilization first. If existing vehicles in that class or location are underutilized, the system surfaces the data before procurement begins — preventing the fleet from growing back after right-sizing.
Unnecessary purchases blocked with utilization evidence
Departmental Guesswork vs. Data-Driven Utilization Management
| Decision Area |
Without Utilization Data |
With OxMaint Utilization Analytics |
Impact |
| Fleet sizing |
Based on department requests and historical fleet size |
Based on per-vehicle utilization scoring and demand analysis |
20-35% excess capacity identified |
| Vehicle allocation |
Dedicated assignment regardless of usage frequency |
Pooling recommended for vehicles used less than 3 days/week |
3 vehicles become 2 with no service loss |
| New vehicle requests |
Approved based on department justification alone |
Validated against current utilization before procurement |
Unnecessary purchases prevented |
| Cross-department visibility |
Each department tracks vehicles in separate spreadsheets |
All departments visible in one unified dashboard |
Surplus in one division fills shortfall in another |
| Seasonal adjustment |
Fleet size stays constant year-round |
Seasonal patterns identified, temporary surplus managed |
Fleet sized for real demand, not peak-only |
| Budget justification |
Anecdotal evidence and complaint-driven requests |
Audit-ready utilization reports with per-vehicle cost data |
Reduction proposals approved with data confidence |
The ROI of Getting Fleet Size Right
$8K-$15K
Annual savings per underutilized vehicle removed from the fleet
10-15%
Fleet reduction typically achievable without any service impact
15-30%
CPM reduction within 12 months for agencies using fleet software
28%
Fleet reduction achieved by Kentucky state agency through utilization analysis
Frequently Asked Questions
How does OxMaint measure vehicle utilization?+
OxMaint tracks days in service, miles driven, engine hours, and trip frequency per vehicle — either from telematics integration or manual entry. Each vehicle receives a utilization score benchmarked against its class and department, with vehicles below threshold flagged automatically for review.
Start a free trial to see utilization scoring configured for your fleet.
How long does it take to get actionable utilization data?+
A reliable utilization baseline requires 90 days of data collection — shorter periods risk seasonal distortion. Ideally, a full 12-month dataset captures seasonal patterns and prevents premature right-sizing decisions. OxMaint starts surfacing preliminary insights within 30 days while building toward the full baseline.
Book a demo to see the timeline for your fleet size.
Will right-sizing leave departments without vehicles when they need them?+
OxMaint accounts for peak demand, seasonal variation, and emergency reserve requirements before recommending any vehicle removal. The system models demand at the 95th percentile — ensuring your fleet covers surge periods, not just average days. Vehicles are only flagged when sustained multi-period data confirms genuine surplus.
Start a free trial to see demand modeling for your operations.
Can OxMaint help justify right-sizing to city council or elected officials?+
Yes. OxMaint generates audit-ready reports with per-vehicle utilization trends, carrying cost calculations, projected savings from fleet reduction, and service level impact analysis. Every recommendation is backed by documented data — the kind of evidence that survives public scrutiny and budget hearing questions.
Book a demo to see a sample right-sizing report.
Does right-sizing only mean removing vehicles?+
No. Right-sizing includes reassigning vehicles between departments, converting dedicated assignments to shared pools, downsizing vehicle class to match actual job requirements, and adjusting seasonal inventory. Removal is only one of several outcomes — OxMaint recommends the action that delivers the best financial result per vehicle.
Start a free trial to explore all right-sizing options.
Fleet Utilization Intelligence — OxMaint
Stop Paying for Vehicles That Sit in Lots — Start Paying for Vehicles That Move
OxMaint delivers per-vehicle utilization scoring, cross-department visibility, seasonal demand adjustment, motor pool modeling, and audit-ready right-sizing reports — so every vehicle in your fleet earns its cost and every reduction decision is backed by data your council can approve.
Per-Vehicle
Utilization scoring that flags surplus automatically
All Departments
Unified visibility across every division
$8K-$15K
Annual savings per vehicle identified for removal
Audit-Ready
Reports that survive budget hearings and public scrutiny