When a county discovers it has been paying $1.4 million annually in lease costs for a 28,000 square-foot annex building that sits 62% vacant—while three departments operate from overcrowded facilities across town—the failure isn't real estate. It's property management. The lease was auto-renewed because nobody tracked the expiration date. The vacancy went unnoticed because no system measured utilization. The overcrowding persisted because space requests were handled through emails that disappeared into inboxes. Meanwhile, the county owns four surplus properties generating zero revenue, accumulating $180,000 annually in carrying costs for insurance, security, and basic maintenance on buildings nobody uses.
This isn't an outlier—it's the norm. The Government Accountability Office (GAO) estimates that federal agencies alone hold over 7,000 excess or underutilized properties costing taxpayers $1.7 billion annually in operating expenses. At the state and municipal level, the problem scales proportionally: fragmented property records across departments, lease portfolios managed in spreadsheets with missed renewal deadlines, space allocation decisions based on political influence rather than utilization data, and surplus properties lingering on the books for years because disposal processes lack systematic tracking.
This guide provides government property managers, public works directors, and administrative services officers with the strategic framework for managing the full property lifecycle—from acquisition and space planning through lease administration and surplus disposal. Discover how digital property management platforms transform government real estate operations. Start Free Trial.
Government Property Portfolio Classification
Effective government property management begins with strategic classification of every asset in the portfolio based on mission criticality, utilization intensity, and financial performance. A courthouse operating at 95% capacity under a long-term ownership model requires fundamentally different management than a field office leased month-to-month at 40% occupancy. Applying uniform management approaches across diverse property types guarantees both wasted resources and unmet service needs.
Property managers must segment their portfolios to align maintenance investment, lease strategies, space planning, and disposition decisions with the strategic value each property delivers to the government mission. Without classification, departments default to treating every building equally—overspending on low-value properties while underfunding mission-critical facilities.
Essential Service Facilities
- Courthouses & Justice Centers
- Public Safety Headquarters
- Emergency Operations Centers
- Data Centers & IT Hubs
Community Service Properties
- City/County Administrative Offices
- Libraries & Community Centers
- Health & Human Services
- Permit & Licensing Centers
Back-Office & Storage
- Administrative Annexes
- Records Storage Facilities
- Fleet Maintenance Yards
- Warehouse & Supply Depots
Disposition Pipeline
- Vacant Former Office Buildings
- Decommissioned Facilities
- Undeveloped Land Parcels
- Properties Below 30% Utilization
The Complete Property Management Lifecycle Checklist
Government property management spans five interconnected disciplines: space planning, lease administration, facility condition management, capital planning, and surplus disposal. This checklist covers every critical action item property managers must systematically address to maximize portfolio value while minimizing taxpayer cost exposure. Schedule a Demo.
Space Planning & Utilization Management
Deploy occupancy sensors or badge-swipe analytics across all facilities to measure actual space usage versus allocated square footage—eliminating guesswork from space decisions
Establish square-footage-per-employee standards by role type (180-250 SF/person for office, 80-120 SF for hoteling) aligned with GSA or state space guidelines
Identify buildings below 65% utilization as consolidation candidates—modeling scenarios for department co-location to reduce total portfolio footprint and operating costs
Recalculate space needs based on hybrid/remote policies reducing in-office presence by 30-50%—right-sizing the portfolio to post-pandemic work patterns
Plan and execute department relocations with CMMS-tracked tasks ensuring IT, furniture, signage, and security access are coordinated without service disruption
Lease Administration & Cost Control
Maintain all lease agreements in a single digital system with key terms extracted: rent, CAM charges, escalation clauses, renewal options, and termination windows
Automate alerts 12, 6, and 3 months before lease expirations, renewal option deadlines, and rent escalation triggers—preventing costly auto-renewals at unfavorable terms
Compare current lease rates against market comps annually to identify above-market leases ripe for renegotiation—typical savings of 8-15% on overdue renegotiations
Audit Common Area Maintenance (CAM) charges annually against lease terms—government tenants overpay CAM by an average of 5-12% due to unverified landlord pass-throughs
Evaluate total cost of ownership versus continued leasing for properties occupied longer than 10 years—factoring in bond financing rates, maintenance costs, and asset appreciation
Facility Condition & Maintenance Management
Conduct building-by-building condition assessments rating every major system (roof, HVAC, electrical, plumbing, envelope) on standardized 1-5 scales with remaining useful life estimates
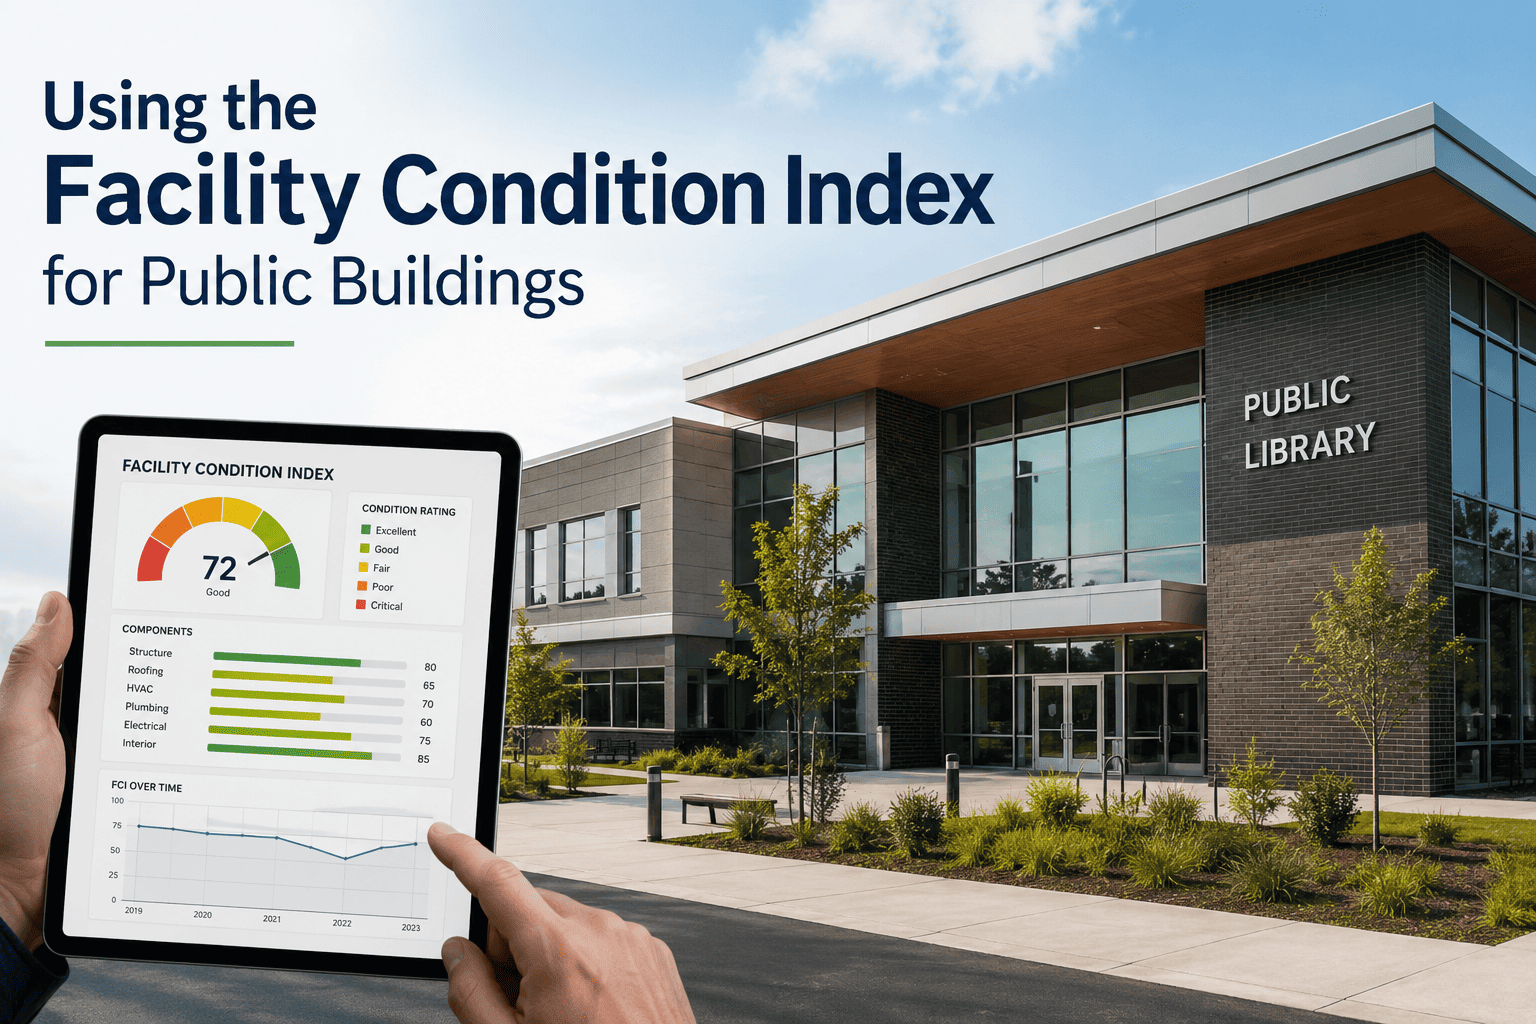
Calculate and track FCI (deferred maintenance ÷ replacement value) for each property—flagging buildings exceeding 0.10 threshold for capital intervention or disposition review
Implement automated PM schedules for all owned properties covering HVAC, roofing, electrical, plumbing, fire protection, and building envelope—tracked through CMMS
Track Energy Use Intensity (EUI) per building using ENERGY STAR Portfolio Manager—identifying facilities consuming 20%+ above benchmark for efficiency retrofits
Maintain a running total of deferred maintenance backlog with cost estimates per building—essential for capital budget justification and risk communication to leadership
Capital Planning & Investment Strategy
Develop rolling CIP prioritizing projects by FCI score, mission criticality, safety risk, and energy savings potential—linking every project to documented facility condition data
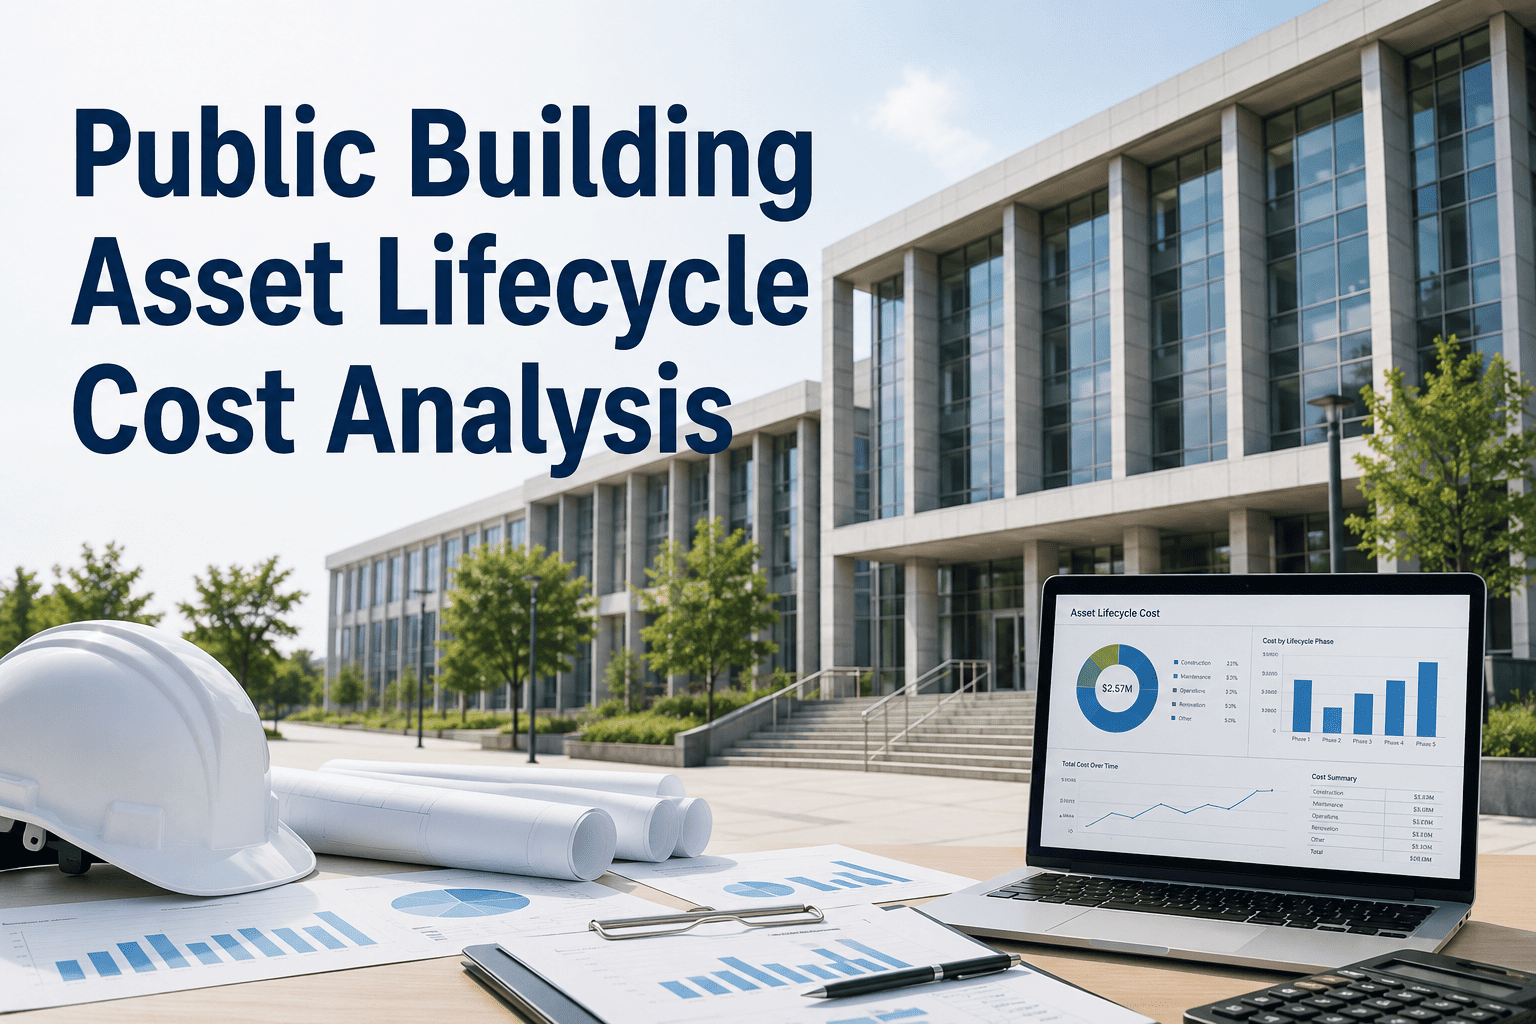
Calculate lifetime costs per property including acquisition, maintenance, energy, staffing, and disposition—identifying properties where disposal saves more than retention
Compare renovation costs against new construction for buildings with FCI exceeding 0.50—renovation typically loses financial viability above 60-65% replacement value
Map available federal, state, and utility incentive programs to planned capital projects—energy efficiency retrofits, ADA improvements, and seismic upgrades often qualify for external funding
Maintain GASB 34-compliant asset records with acquisition costs, depreciation schedules, and condition assessments supporting the Modified Approach for infrastructure reporting
Surplus Property Disposal & Transfer
Establish clear thresholds triggering surplus review: below 30% utilization for 12+ months, FCI above 0.60, annual carrying costs exceeding alternative solutions by 25%+
Complete Phase I Environmental Site Assessments before marketing surplus properties—unresolved contamination delays sales 2-5 years and reduces value 30-60%
Before public disposal, circulate surplus properties to other government agencies—inter-agency transfers avoid disposal costs and often satisfy unmet space needs
Evaluate auction, sealed bid, negotiated sale, and community transfer options based on property type, market conditions, and policy requirements for each surplus asset
Calculate and report monthly carrying costs (insurance, security, utilities, maintenance) for every surplus property—creating urgency for disposal by quantifying the cost of inaction
Integrated Property Management Architecture
Modern government property management requires a connected ecosystem where data flows seamlessly between property records, lease agreements, facility condition systems, space utilization sensors, and financial ledgers. When a lease approaches expiration, the system triggers a chain reaction: utilization review, market benchmarking, consolidation analysis, and budget impact assessment. This integration eliminates the information silos where leases auto-renew unreviewed and surplus properties accumulate carrying costs for years.
The integration between property management systems and CMMS enables "smart portfolio" decisions. Instead of discovering a lease auto-renewed at above-market rates, the system flags the upcoming deadline, pulls utilization data showing 45% occupancy, and presents a consolidation scenario eliminating $340,000 in annual lease costs. Start Free Trial.
Key Performance Indicators for Portfolio Excellence
Government property management requires tracking KPIs that reveal the true financial performance and strategic alignment of every asset in the portfolio. These metrics should drive decisions about investment, disposition, and space allocation—replacing political influence with data-driven portfolio optimization visible to elected officials and taxpayers.
Average occupancy across all owned and leased properties. Below 65% signals significant consolidation opportunity reducing portfolio operating costs.
Total occupancy cost (rent, maintenance, utilities, insurance) normalized by area. Compare owned vs. leased and benchmark against market rates.
Percentage of total leased square footage expiring within 12 months. High concentration creates budget risk and reduces negotiation leverage.
Ratio of deferred maintenance cost to replacement value for owned properties. Above 0.10 indicates deterioration; above 0.30 suggests disposal may be more economical than renovation.
Average time from surplus declaration to completed disposal. Faster disposal reduces carrying costs averaging $3-8/SF annually on vacant properties.
Energy consumption per square foot per year. Identifies underperforming buildings where HVAC maintenance or envelope improvements yield significant savings.
Regulatory Compliance & Risk Mitigation
Government properties operate under overlapping federal, state, and local regulatory frameworks covering environmental compliance, accessibility, historic preservation, financial reporting, and disposal procedures. Digital record-keeping with automated compliance tracking is the only defense against audit findings, legal liability, and the political consequences of mismanaged public assets. Book a Demo.
Strategic Perspective on Government Real Estate Transformation
Government real estate management is undergoing its most significant transformation in decades. The post-pandemic shift to hybrid work has created a once-in-a-generation opportunity to right-size portfolios that have accumulated excess space through decades of incremental growth. Agencies that seize this window can reduce portfolio footprint by 20-35% while improving service delivery through strategic consolidation into higher-quality, better-located facilities.
The most successful property managers are treating their portfolios as investment assets requiring active management—not just buildings requiring maintenance. They use utilization data to challenge space requests, lease analytics to renegotiate at market rates, and condition data to make dispassionate decisions about renovation versus disposal. Every property must justify its place in the portfolio through mission value and financial performance.
The integration of facility condition management with property strategy is the critical frontier. When a CMMS provides real-time data showing that a building's maintenance costs are accelerating while its utilization is declining, the disposal decision becomes data-driven rather than political. That evidence transforms budget conversations from opinion-based debates into fact-based portfolio optimization.
Conclusion: Portfolio Stewardship as Public Trust
Government property management is fundamentally an exercise in public trust. Every vacant building accumulating carrying costs, every lease auto-renewed without market analysis, every surplus property lingering on the books for a decade—these represent taxpayer resources consumed without return. The agencies that manage property portfolios as strategic assets rather than administrative burdens deliver measurable value: lower occupancy costs, higher space utilization, faster surplus disposal, and facility conditions that support rather than impede public service delivery.
Effective property portfolio management requires a systematic approach: strategic classification driving investment decisions, utilization data replacing political allocation, lease analytics preventing above-market renewals, condition assessments justifying capital investment, and disposal processes converting surplus liabilities into revenue or community benefit. The digital tools to achieve this—integrated CMMS, property management platforms, and IoT sensors—are now accessible to agencies of every size.
By transitioning from passive property administration to active portfolio optimization, government property managers can demonstrate the fiscal stewardship that taxpayers demand and elected officials require. The result is a property portfolio that maximizes mission value per dollar invested—and an operation that withstands the scrutiny of any audit, budget review, or public records request. Start Your Free Trial.
Frequently Asked Questions
How does a CMMS support government property portfolio management?
A CMMS provides the facility condition data foundation that property portfolio decisions require. By tracking maintenance costs, equipment condition, and building system remaining useful life across every owned property, the CMMS generates the Facility Condition Index (FCI) data that determines whether a property warrants capital investment, renovation, or disposal. When integrated with lease administration and space utilization data, the platform enables holistic portfolio optimization—ensuring every dollar goes to properties delivering maximum mission value.
How do we identify which properties are candidates for disposal?
Apply three screening criteria: (1) Utilization below 30% for 12+ consecutive months with no projected demand increase. (2) Facility Condition Index above 0.50, meaning deferred maintenance exceeds half the building's replacement value. (3) Annual carrying costs (maintenance, utilities, insurance, security) that exceed the cost of alternative solutions like leasing or co-location. Properties meeting any two criteria should enter the formal surplus review process. CMMS data on maintenance costs and condition scores provides the objective evidence needed to move past political resistance to disposal.
What is the typical timeline and process for surplus property disposal?
Government surplus disposal follows mandated sequential steps: surplus declaration by the governing body, inter-agency screening (30-90 days), environmental assessment (Phase I: 30-45 days; Phase II if needed: 60-120 days), appraisal, public notice, and competitive sale process. Total timeline averages 12-24 months for clean properties but extends to 5-7+ years when environmental contamination exists. Digital disposal workflow tracking ensures no step is missed, deadlines are met, and carrying costs are documented throughout—creating urgency for timely completion.
How can we reduce government lease costs without reducing space quality?
Four strategies deliver 10-25% lease cost reduction: (1) Never auto-renew—every expiration is a renegotiation opportunity where market analysis typically reveals 8-15% savings potential. (2) Audit CAM charges annually against lease terms—government tenants overpay an average of 5-12%. (3) Consolidate departments from multiple small leases into fewer, larger spaces where per-SF rates are lower. (4) Negotiate tenant improvement allowances for long-term commitments—landlords invest $15-40/SF in build-out for 10-year government tenants with strong credit. Centralized lease tracking prevents the missed deadlines that force unfavorable renewals.
How does space utilization data improve property decisions?
Utilization data replaces assumptions with facts. Occupancy sensors or badge-swipe analytics reveal actual space usage patterns: which buildings, floors, and zones are used at what percentage, on which days, and during which hours. This data drives three critical decisions: (1) Consolidation—identifying buildings below 65% utilization as candidates for department co-location. (2) Hybrid space design—converting underused private offices into shared collaboration spaces matching actual work patterns. (3) Lease right-sizing—reducing leased square footage to match proven demand rather than estimated headcount. Agencies deploying utilization measurement typically reduce portfolio footprint 15-25% within 24 months.