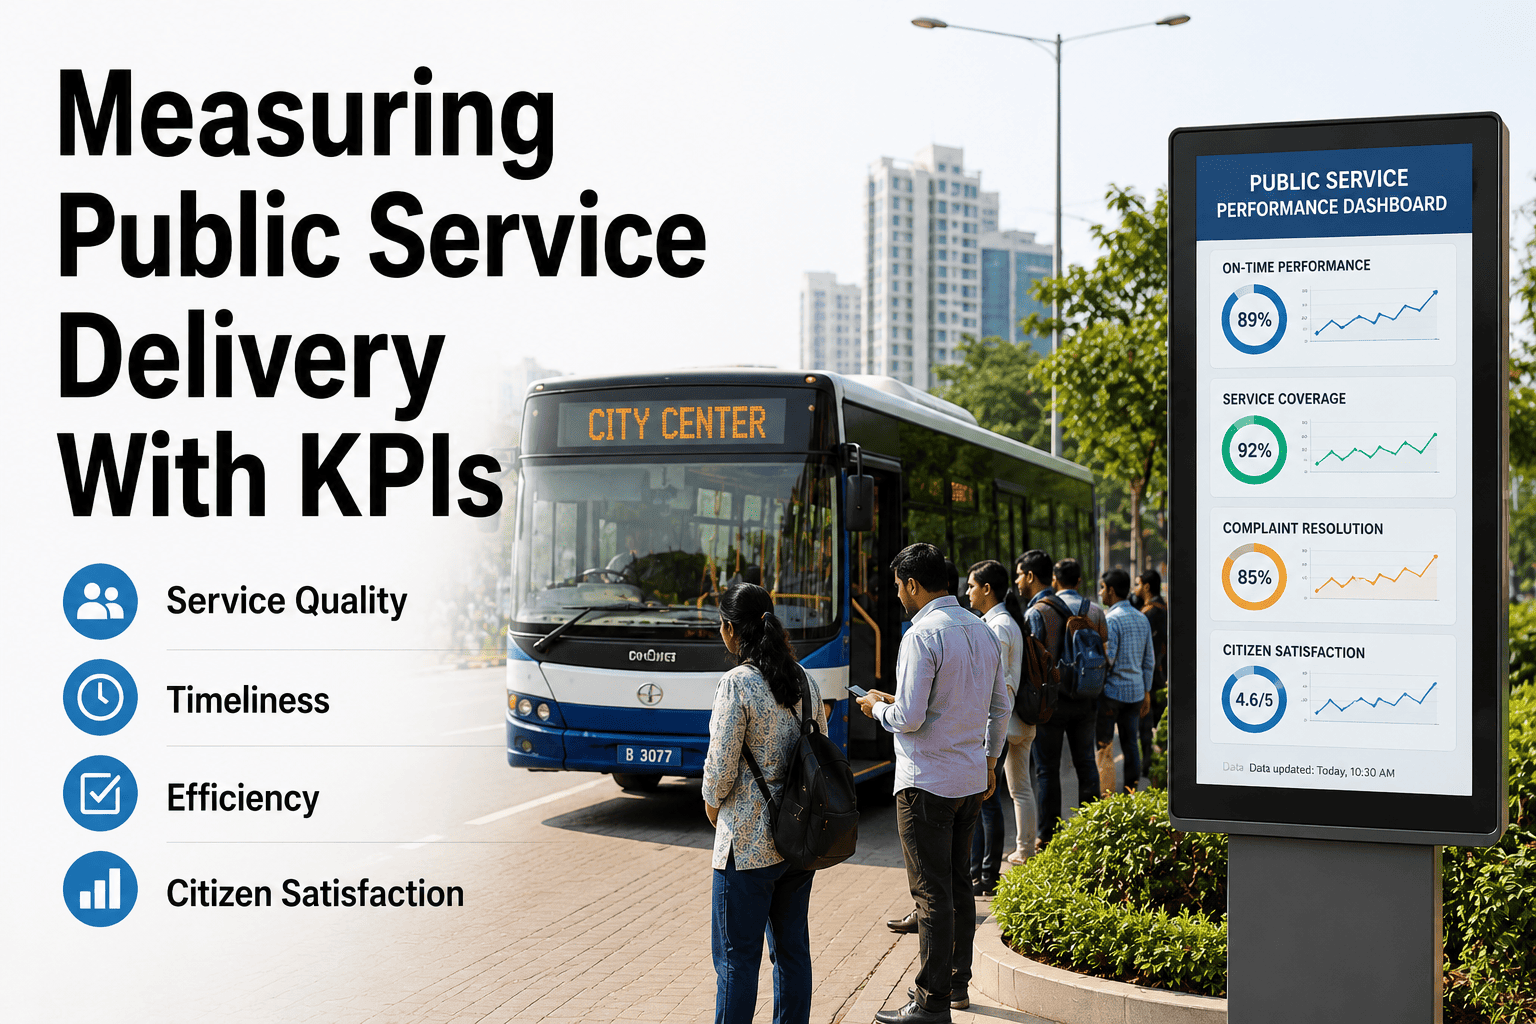
Public service delivery KPIs are the measurable indicators that show whether government agencies are meeting their obligations to citizens — from emergency response times to asset reliability, resolution rates, and customer satisfaction. When municipal service KPIs are tracked systematically, public works departments shift from being activity-managed (counting work orders closed) to outcome-managed (delivering reliable, cost-effective service). Modern public sector performance metrics frameworks tie directly to asset condition, preventive maintenance compliance, and downtime reduction, which is why more agencies are adopting Start Free Trial CMMS platforms like OxMaint to automate the collection and reporting of these critical benchmarks.
What gets measured gets funded — and improved.
Most municipal agencies track activity, not outcomes. The right public service delivery KPIs turn reactive maintenance logs into a performance-managed system that proves value, secures budgets, and improves service to citizens.
Activity-managed vs. outcome-managed public service delivery
A crew that closes 400 work orders a month looks productive — until you realize 280 were repeat fixes on the same three assets. Government performance metrics must measure outcomes, not just activity.
| Dimension | Activity-Managed (Status Quo) | Outcome-Managed (KPI-Driven) |
|---|---|---|
| Primary question | How many work orders did we close? | Did asset reliability and citizen service improve? |
| Backlog view | Unknown — buried in paper logs | Real-time aging dashboard by asset & priority |
| PM compliance | Estimated, reported annually | Tracked daily, targeted at 90%+ |
| Budget justification | "We need more staff" | "Downtime dropped 35%, saving $180K/yr" |
| Citizen satisfaction | Complaint-driven, anecdotal | Surveyed per resolution, benchmarked monthly |
Seven public service KPIs every municipal agency should track
These government service delivery metrics span operational efficiency, asset reliability, financial stewardship, and citizen experience. Each one should have a target, a data source, and a review cadence.
Mean Response Time
Average elapsed time from a service request being logged to a crew arriving on-site. Target varies by service type: under 2 hours for emergency water main breaks, under 48 hours for pothole reports.
First-Time Fix Rate
Percentage of work orders resolved on the first visit without a return trip. Municipal teams hitting 75%+ FTF rates cut repeat labor costs by up to 30% and dramatically improve citizen satisfaction.
PM Compliance Rate
Percentage of scheduled preventive maintenance tasks completed on time. Agencies above 90% PM compliance typically see 25–40% fewer emergency breakdowns on critical infrastructure assets.
Work Order Backlog Age
Average age of open work orders, segmented by priority. A backlog exceeding 30 days on non-deferred items signals a staffing, parts, or prioritization problem that will eventually surface as a citizen complaint.
Cost Per Asset Managed
Total maintenance expenditure (labor + parts + contractor) divided by number of assets under management. Benchmarked over time, this reveals whether your maintenance strategy is becoming more or less efficient.
Service Request Resolution Rate
Percentage of citizen-reported service requests resolved within the published SLA timeframe. High resolution rates correlate directly with public trust and fewer escalated complaints to elected officials.
Citizen Satisfaction Score
Post-resolution survey rating, typically on a 1–5 scale, converted to a percentage. Best collected via SMS or email immediately after work order closure — response rates of 15–25% are achievable in the public sector.
A step-by-step timeline for building a public service KPI dashboard
Rolling out municipal performance metrics is a 90-day process if the data infrastructure is in place. Here is the phased approach public works and facilities teams use to go from spreadsheets to a live KPI dashboard.
Audit & Asset Register
Inventory every asset (pumps, vehicles, HVAC, streetlights) in a central CMMS. Assign criticality ratings (A/B/C) so KPIs prioritize the assets that matter most to public safety and service continuity.
Define Targets & Data Sources
For each KPI, establish a baseline (current performance), a target (where you want to be in 6–12 months), and the data source. A CMMS like OxMaint auto-captures response time, PM compliance, and backlog from every closed work order.
Dashboard & Review Cadence
Publish a live dashboard accessible to department heads and elected officials. Hold a 30-minute weekly KPI review with maintenance supervisors — what gets reviewed weekly improves; what gets reviewed annually does not.
How a 180-asset municipal works department cut backlog by 52%
A mid-sized city's public works division managed 180 assets — fleet vehicles, water pumps, traffic signals, and building HVAC — across 7 technicians using paper work orders and a shared spreadsheet. Their backlog was growing 12% per quarter.
The shift: OxMaint's automated PM scheduling brought compliance from 61% to 94% in the first quarter, which prevented the cascade of emergency breakdowns driving the backlog. The department presented the KPI dashboard at the next council budget hearing and secured funding for two additional technicians.
From manual reporting to a live public service KPI engine
OxMaint is built for maintenance and reliability teams who need to prove outcomes — not just log activity. Every work order, PM task, and asset event feeds automatically into the KPIs that matter to your agency and your stakeholders.
Live KPI Dashboards
Response time, PM compliance, backlog age, and resolution rate update in real time as technicians close work orders on mobile. No more end-of-month spreadsheet marathons — your dashboard is always council-ready.
Automated PM Scheduling
Schedule preventive maintenance by calendar, meter reading, or condition trigger. OxMaint auto-generates work orders and assigns them — pushing PM compliance above 90% without manual follow-up.
Asset Criticality & History
Every asset carries a full maintenance history, criticality rating, and cost rollup. Prioritize work by impact on public service, and justify capital replacement with hard data instead of anecdotes.
Parts Inventory & Cost Tracking
Link spare parts to work orders automatically so cost-per-asset is always accurate. Set min/max levels and get reorder alerts — no more delayed repairs because a critical part is out of stock.
Stop reporting activity. Start proving outcomes.
See how OxMaint turns your work orders into a live public service KPI dashboard — book a 30-minute demo with our team today.
Public sector KPI benchmarks: where does your agency stand?
Use these benchmark ranges — drawn from public works and municipal facilities data — to set realistic targets. Agencies in the top quartile typically use a CMMS to automate data capture; bottom-quartile agencies rely on paper or spreadsheets.
| KPI | Bottom Quartile | Median | Top Quartile |
|---|---|---|---|
| PM Compliance Rate | Below 60% | 75–80% | 90%+ |
| First-Time Fix Rate | Below 50% | 60–68% | 75%+ |
| Work Order Backlog (days) | 45+ days | 25–35 days | Under 15 days |
| Emergency vs. Planned Ratio | 60/40 reactive | 40/60 | 20/80 planned |
| SLA Resolution Rate | Below 65% | 75–82% | 90%+ |
| Citizen Satisfaction | Below 60% | 70–78% | 85%+ |
Public service delivery KPIs: frequently asked questions
What are the most important KPIs for public service delivery?
The most important public service delivery KPIs are mean response time, first-time fix rate, PM compliance rate, work order backlog age, cost per asset managed, SLA resolution rate, and citizen satisfaction score. Together these cover operational efficiency, asset reliability, financial stewardship, and citizen experience. A CMMS like OxMaint captures all seven automatically from day-to-day work order activity.
How do you measure government service delivery performance?
Government service delivery performance is measured by tracking work order data — creation time, assignment time, resolution time, parts used, and outcome — against published service-level agreements. The key is having a centralized system that captures this data at the point of work rather than reconstructing it from paper logs. You can see this in action when you Book a Demo of OxMaint's live dashboard.
What is a good PM compliance rate for municipal maintenance?
A good PM compliance rate for municipal maintenance is 90% or higher. Agencies below 75% typically experience 25–40% more emergency breakdowns, longer service outages, and higher year-over-year repair costs. Hitting 90%+ requires automated PM scheduling — manual calendar reminders consistently underperform because they depend on someone remembering to act.
How can a CMMS improve public sector KPIs?
A CMMS improves public sector KPIs by automating data capture at the point of work — every work order, PM task, and parts transaction feeds directly into dashboards without manual entry. This eliminates reporting lag, exposes backlog and compliance issues in real time, and gives maintenance supervisors the visibility to act before problems escalate. OxMaint's AI-driven predictive maintenance can even forecast asset failures 7–14 days in advance.
How long does it take to implement a KPI dashboard for public works?
With a CMMS like OxMaint, a functional KPI dashboard can be live in 30–90 days depending on asset count and data cleanliness. The first month is asset registration and criticality ranking, the second is defining targets and data sources, and the third is dashboard configuration and review cadence setup. Agencies migrating from paper see immediate baseline data; those migrating from spreadsheets can be live in as little as two weeks.
Turn your maintenance data into proof of public value.
Join the municipal agencies using OxMaint to track public service KPIs, cut downtime, and justify budgets with hard data. Start your free trial or book a personalized demo today.
Free 14-day trial · No credit card