Municipal facilities run on people — inspectors, technicians, planners, and supervisors who depend on accurate data to stay productive. Yet most public works departments still manage workforce tasks through disconnected spreadsheets and paper-based logs, leaving supervisors blind to where time is lost, which crews are overloaded, and which assets are silently failing. OxMaint AI brings workforce optimization and analytics together in a single platform built for government operations, giving facility managers the visibility they need to make every work shift count. Start your free trial and see your workforce data live within days.
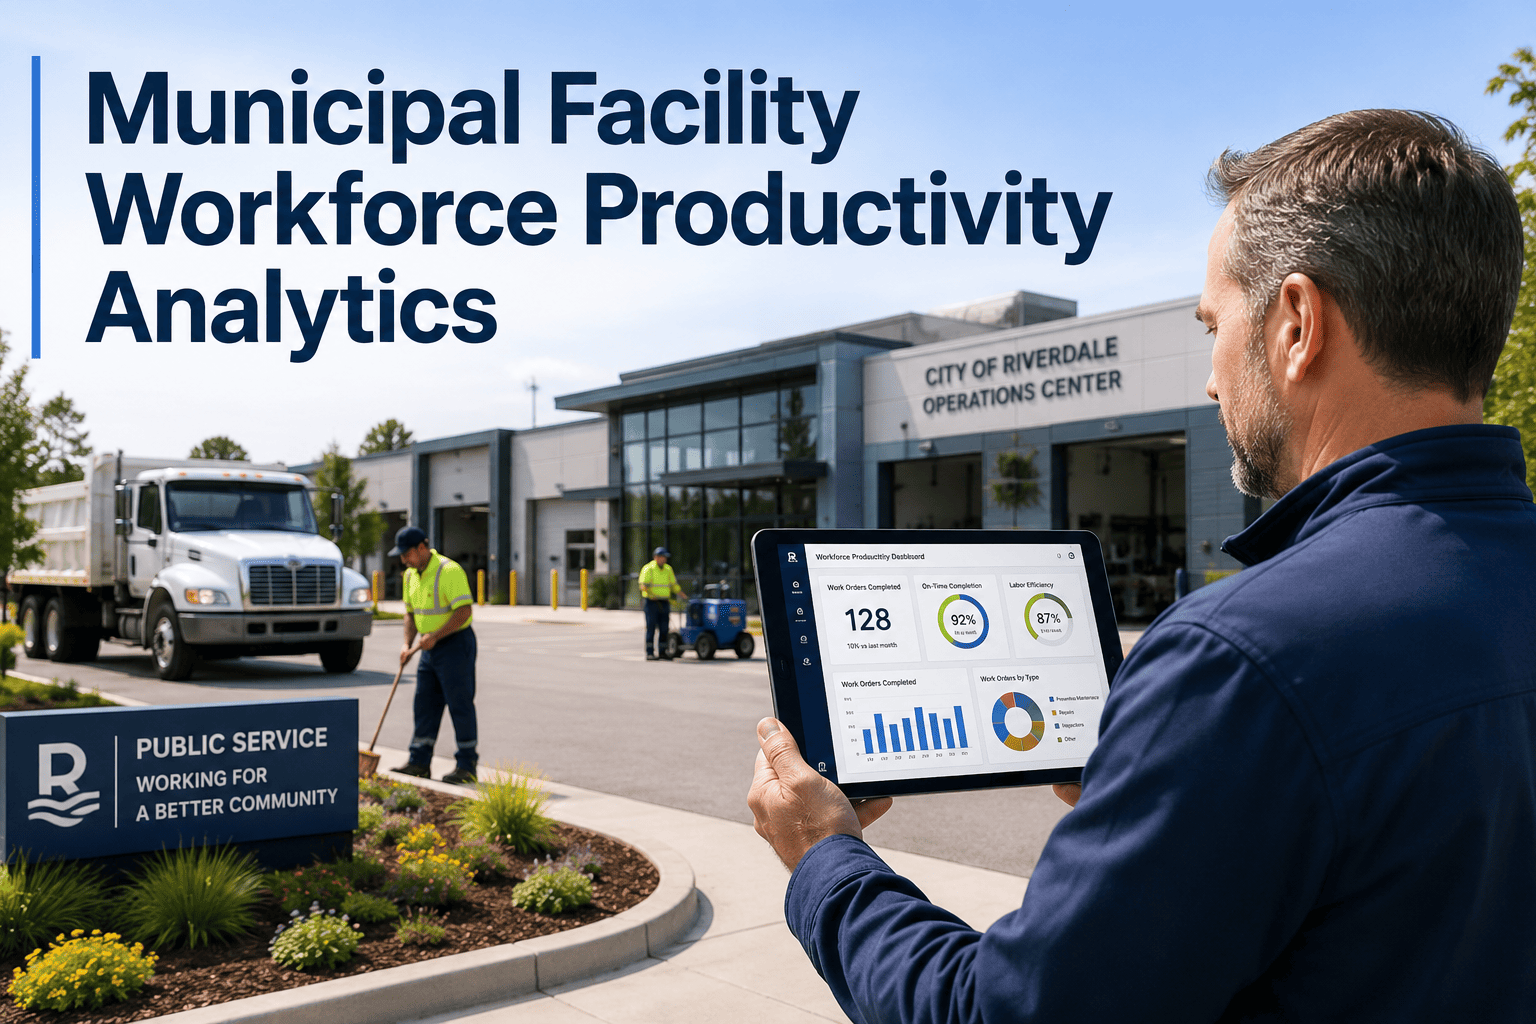
Workforce Productivity Analytics for Municipal Facilities
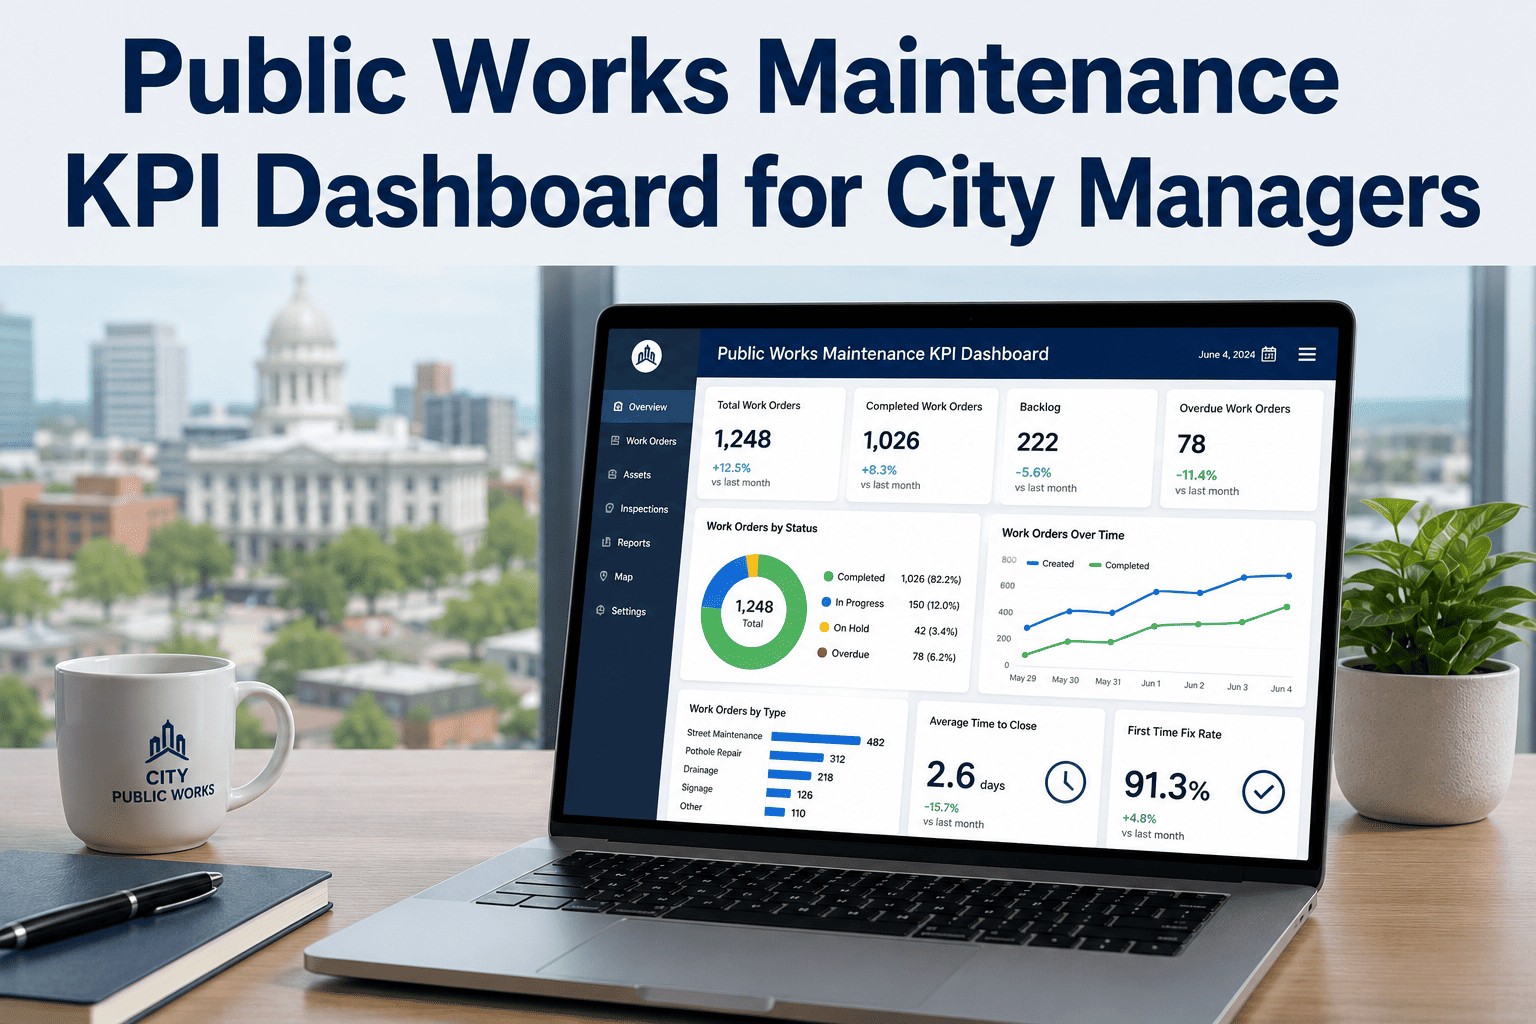
Turn scattered maintenance logs into real-time workforce intelligence. OxMaint AI helps city managers, public works directors, and facility supervisors track crew performance, reduce idle time, and prove productivity to auditors.
The Workforce Visibility Gap in Public Works
Government maintenance teams face a unique problem. Work happens across distributed locations, multiple shifts, and dozens of asset types — yet reporting is done manually, weekly, and always incomplete.
How OxMaint AI Solves Workforce Optimization
Every feature is built around the specific reporting and compliance requirements of government maintenance operations.
Before vs After: Workforce Productivity Outcomes
Measured across 12 municipal facility deployments over the first 90 days of OxMaint AI implementation.
| Metric | Before OxMaint | After 90 Days | Improvement |
|---|---|---|---|
| Work Orders Completed Per Technician / Week | 4.1 | 11.4 | +178% |
| Average Work Order Close Time | 11.4 days | 3.2 days | -72% |
| Supervisor Reporting Hours Per Week | 8.5 hrs | 1.2 hrs | -86% |
| PM Compliance Rate | 58% | 91% | +57% |
| Overdue Work Order Backlog | 214 WOs | 38 WOs | -82% |
| Audit Preparation Time | 3 days | 2 hours | -93% |
Your city's maintenance data already tells a story. OxMaint AI just makes it readable in real time.
Expert Perspective
Municipal maintenance teams are often managing more assets per technician than any private sector equivalent — but with a fraction of the analytics capability. The single most impactful intervention is giving supervisors a live view of workforce activity. When managers can see real-time completion rates and backlog trends, they reduce reactive firefighting by 40 to 60 percent within the first quarter. The data is already being generated by field work; the gap is surfacing it in a form that supports daily decisions rather than monthly reports.
Frequently Asked Questions
Stop compiling reports manually. Start managing your municipal workforce with live analytics that city managers, auditors, and council members can all rely on.
Live workforce dashboards. Automated KPI reporting. Mobile work order execution. Built for public works and government facility teams.