Public works teams manage hundreds of assets — roads, bridges, water systems, parks — yet most city maintenance operations still track KPIs on spreadsheets that no one trusts and dashboards no one checks. When a city manager cannot answer "what is our average work order completion time?" without pulling three reports, the maintenance operation is flying blind. OxMaint AI gives public works departments a single real-time analytics platform that converts maintenance activity into the KPIs city managers, directors, and council members actually need. Start your free OxMaint trial or book a 30-minute demo to see what your public works data looks like in a real dashboard.
Government · Public Works · Analytics & Reporting
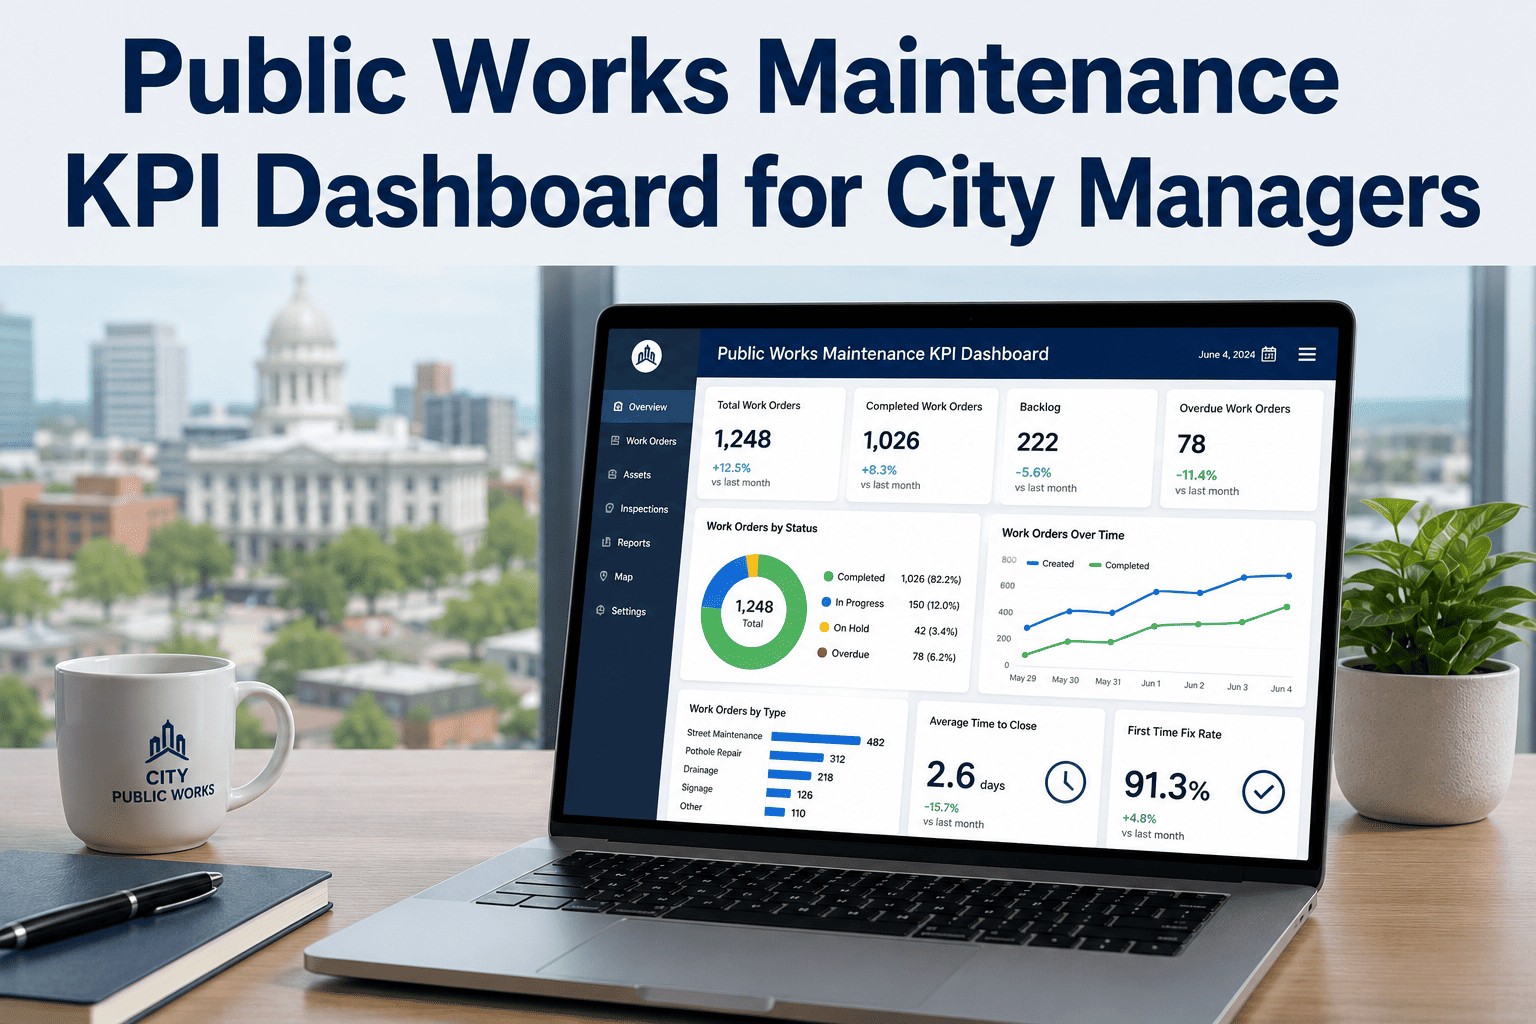
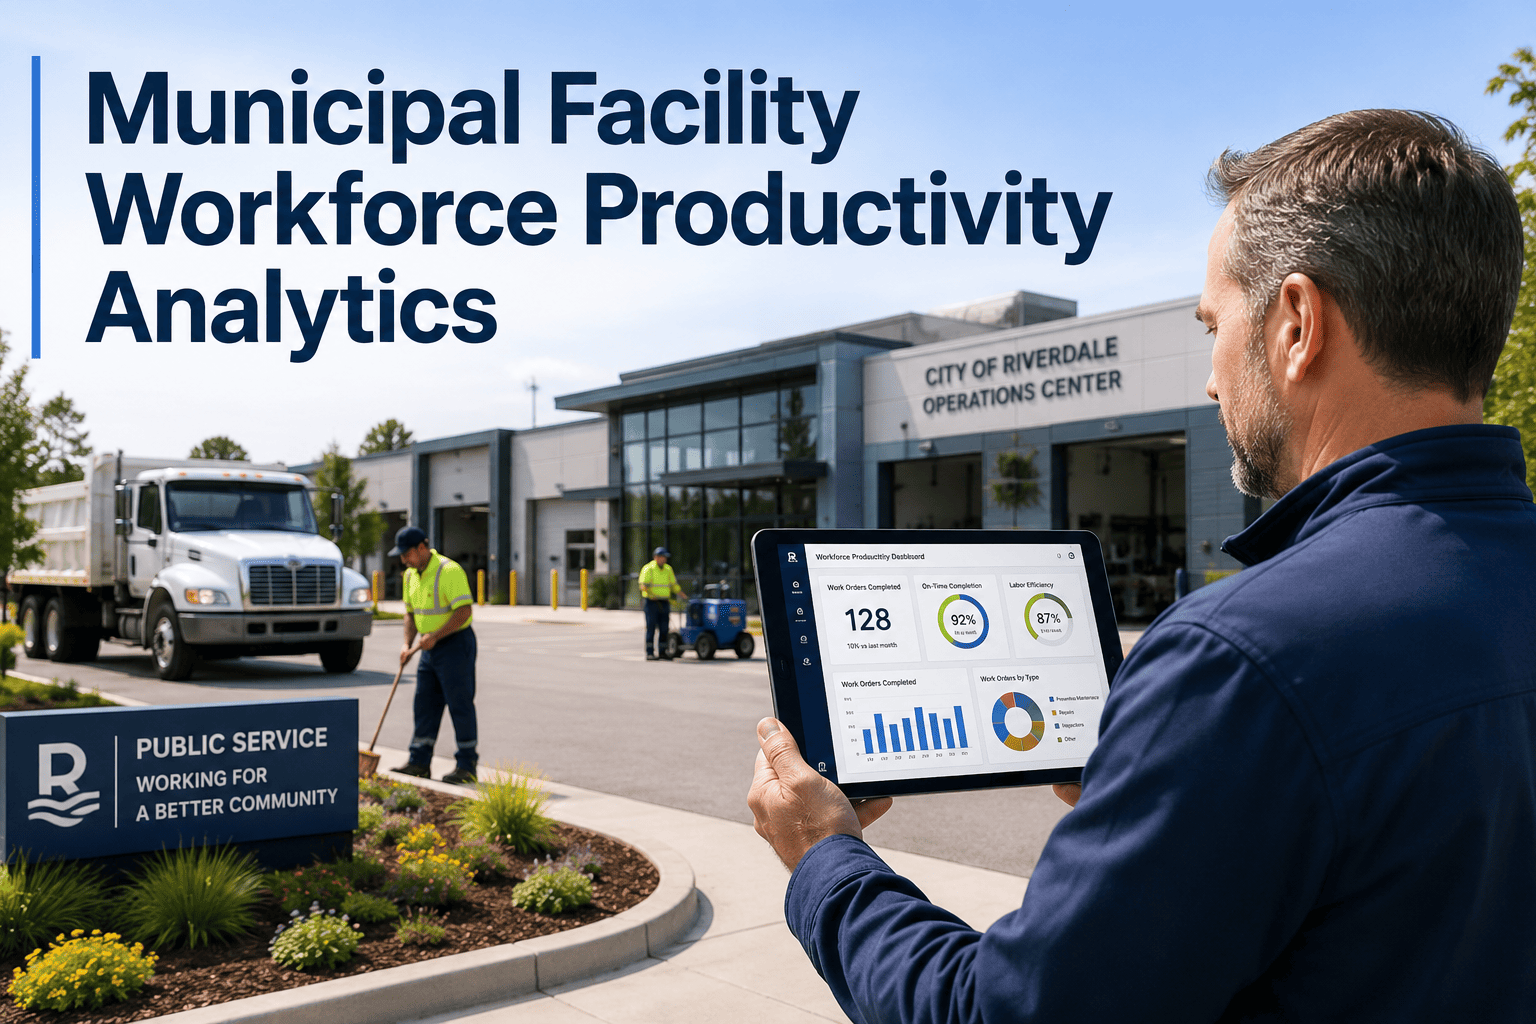
Public Works Maintenance KPI Dashboard for City Managers
Stop reporting from memory. Get real-time KPIs on work order performance, asset health, crew productivity, and compliance — built for public sector operations.
67%
of city maintenance teams lack real-time KPI visibility
3.2x
faster reporting cycle with a CMMS analytics platform
40%
reduction in reactive maintenance with structured PM tracking
The Challenge
Why Public Works KPI Reporting Fails City Managers
01
Data Lives in Silos
Work orders in one system, asset records in another, crew schedules in a spreadsheet. Nobody has the full picture at budget review time.
02
KPIs Are Backward-Looking
Monthly reports show what happened last month. By the time a maintenance trend is visible, it has already cost the department weeks of reactive overtime.
03
No Accountability Trail
When an audit or council inquiry arrives, staff spend days reconstructing who did what, on which asset, with what parts — instead of answering from a system of record.
04
Compliance Risk Is Hidden
Missed PM intervals on vehicles, water infrastructure, or public facilities create regulatory exposure — but without automated tracking, misses only surface after the inspection.
KPI Framework
The 6 KPIs Every City Manager Needs on Their Dashboard
OxMaint structures public works reporting around six proven KPI categories. Each drives a different operational decision — and each is tracked automatically as work is completed in the field.
A
Work Order Completion Rate
Percentage of work orders completed on time vs. opened. Breaks down by crew, asset type, and priority. Identifies bottlenecks before they become backlogs.
Target: above 85% on-time closure
B
Mean Time to Repair (MTTR)
Average hours from fault report to asset restoration. High MTTR on road or utility assets means extended service disruption and citizen complaints.
Benchmark: under 4 hours for critical assets
C
Planned vs. Reactive Ratio
The single most important indicator of maintenance program maturity. A ratio below 60:40 planned-to-reactive signals a department spending more on emergencies than prevention.
Goal: 70% planned or higher
D
PM Compliance Rate
Percentage of scheduled preventive maintenance tasks completed on time. Directly tied to regulatory compliance for fleet, water systems, and public facility equipment.
Minimum: 90% for regulated assets
E
Cost per Work Order
Labor plus parts cost tracked per work order, per asset category, and per department. Gives budget owners defensible data at appropriations time.
Track trend line quarter over quarter
F
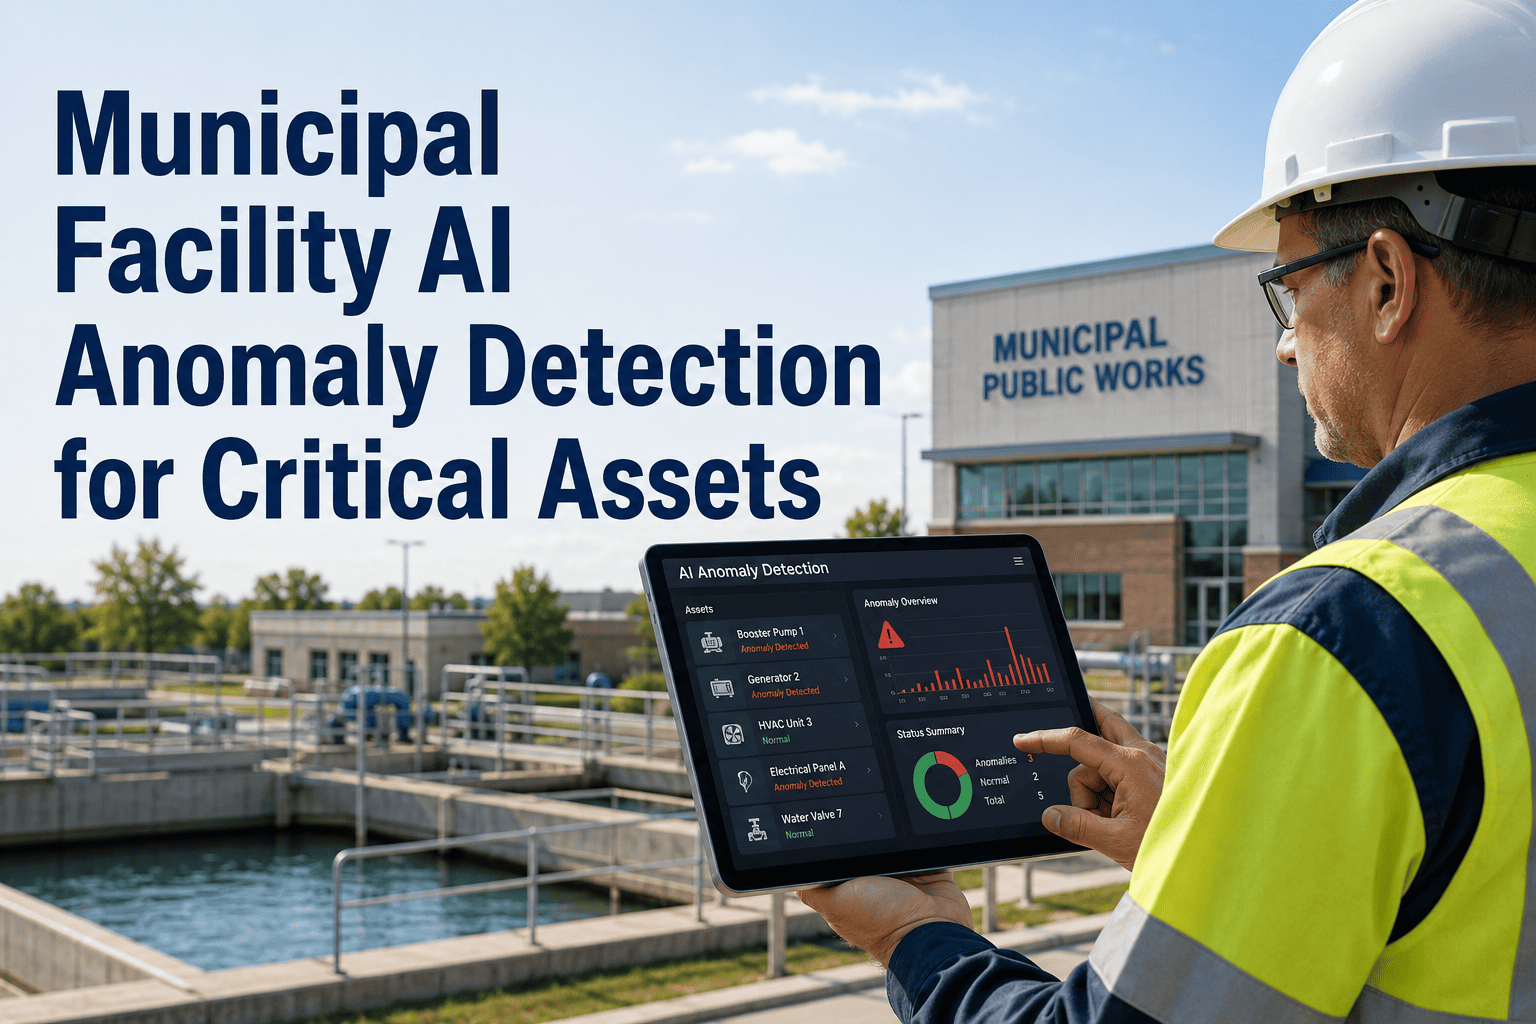
Asset Health Index
Composite score built from fault frequency, repair cost trend, and PM adherence for each asset. Drives capital replacement planning before failures become emergencies.
Flag assets scoring below 60 for review
See Your Public Works KPIs in Real Time
OxMaint connects your field crews, work orders, and asset records into a live dashboard your leadership team can read without a data analyst.
Platform Features
How OxMaint Delivers Public Works Analytics
Automated Reporting
Scheduled reports delivered to department heads and city managers without anyone pulling data manually. Configure daily, weekly, or monthly cadence per role.
Asset-Level Drill-Down
Click any KPI to see the underlying work orders, assets, and crew assignments. Audit-ready detail available without leaving the dashboard.
Compliance Alert Engine
Automated alerts when PM compliance drops below threshold for regulated asset categories — vehicles, water infrastructure, HVAC, electrical systems.
Budget vs. Actuals Tracking
Real-time labor and parts spend tracked against department budgets. Identify overspend by asset category before the quarter closes.
Before vs. After
What Changes When Public Works Gets a Real KPI Dashboard
| Reporting Area |
Without OxMaint |
With OxMaint |
| Work Order Status |
Manual tally from supervisor notes |
Live dashboard with completion rate by crew |
| PM Compliance |
Known only after a missed inspection |
Real-time compliance rate with overdue alerts |
| Budget Reporting |
Month-end spreadsheet compile |
Running cost per work order by department |
| Audit Response |
Days of document retrieval |
Instant filtered work order history export |
| Capital Planning |
Based on age or gut instinct |
Asset health index with repair cost trend |
Frequently Asked Questions
Public Works KPI Dashboard — Common Questions
What KPIs matter most for a city public works department?
The four most impactful KPIs are work order completion rate, PM compliance rate, planned-to-reactive maintenance ratio, and cost per work order. Together they reveal whether a department is ahead of failures or constantly chasing them.
OxMaint tracks all four automatically from field activity with no manual data entry.
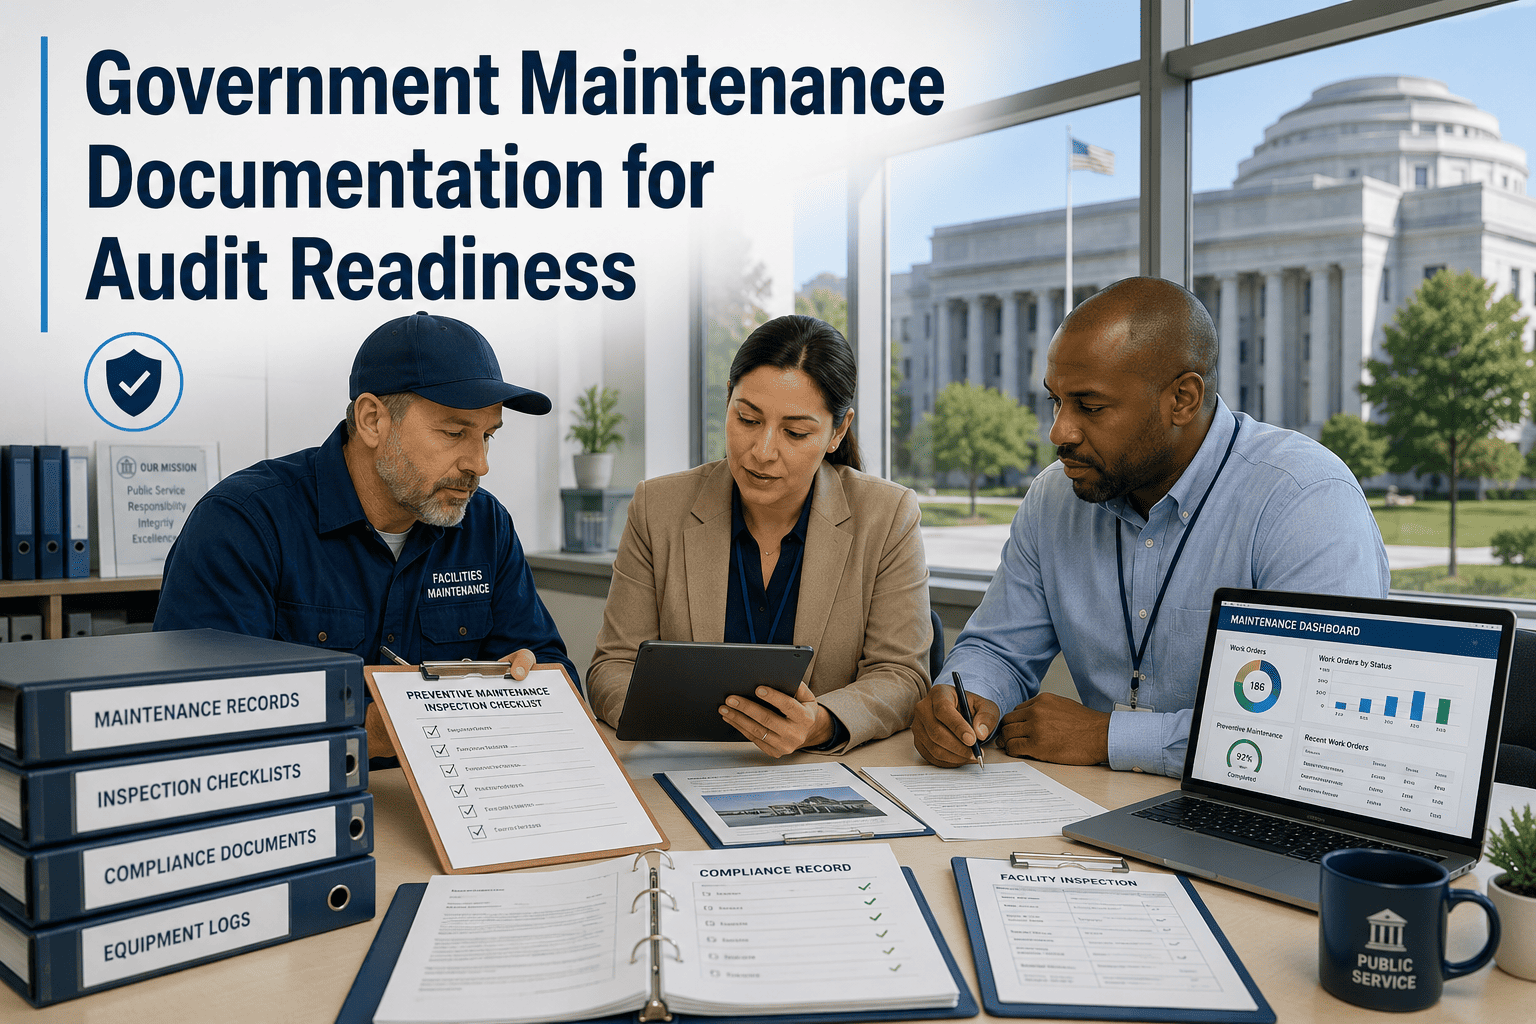
How does a CMMS improve public sector compliance reporting?
A CMMS creates timestamped, auditable records of every PM, inspection, and repair. When regulators or auditors request compliance documentation, it is exportable in minutes rather than assembled over days.
See the compliance module in a live demo.
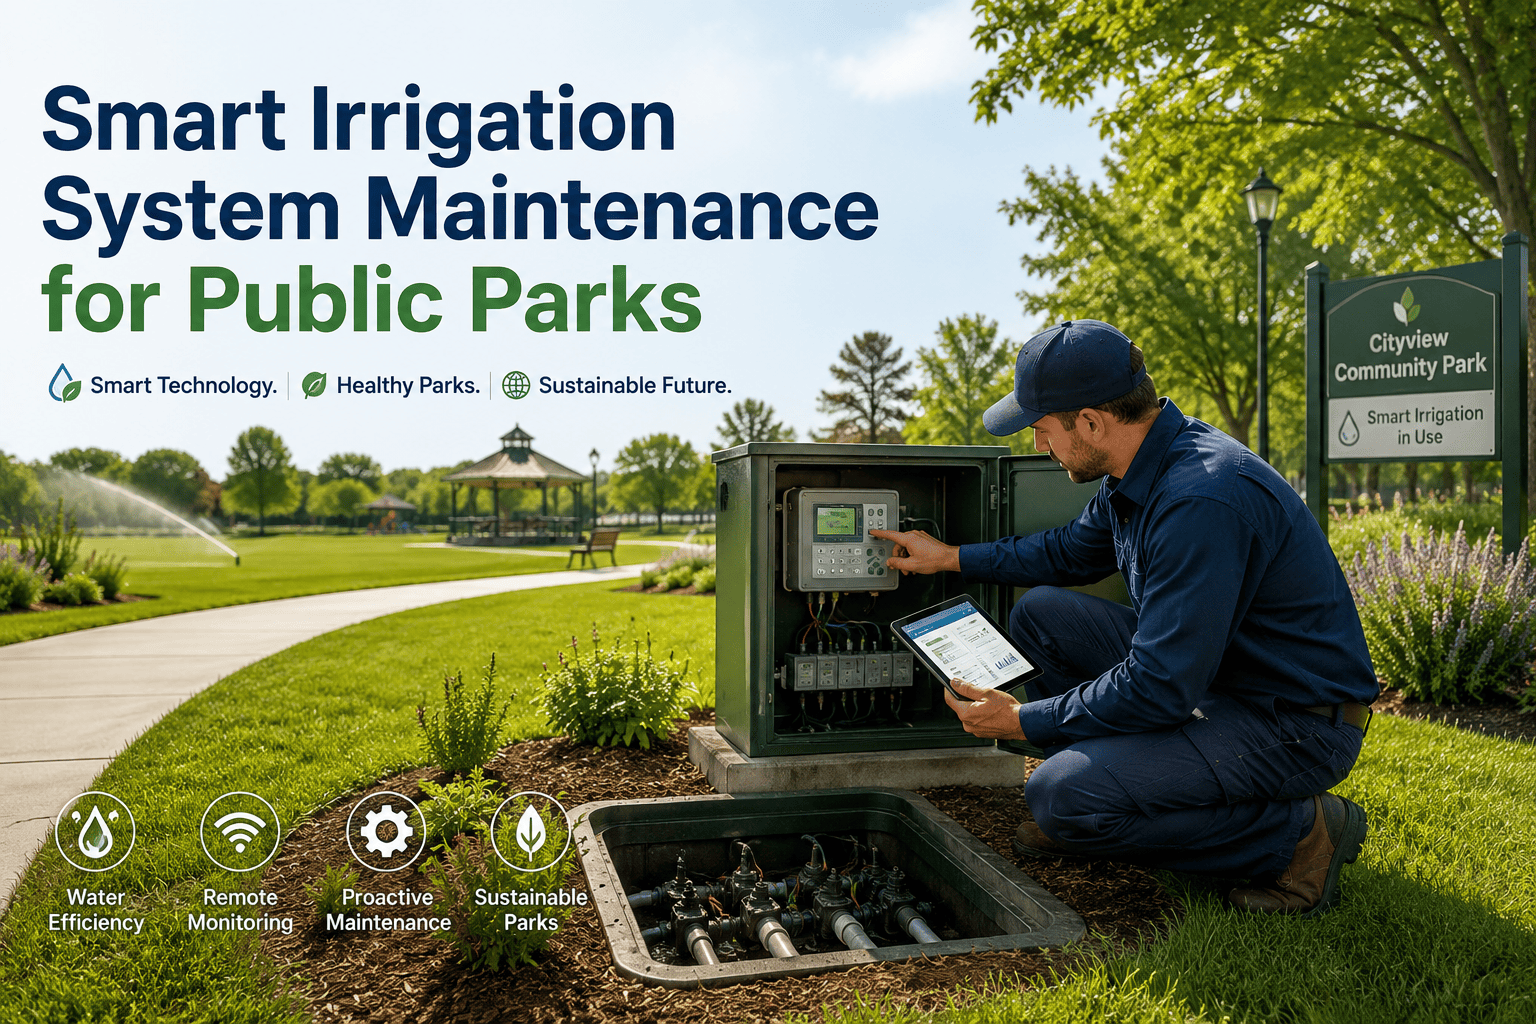
Can OxMaint handle multiple public works divisions in one dashboard?
Yes. OxMaint supports multi-department structures with role-based access. A parks supervisor sees parks assets; a city manager sees all divisions. KPIs roll up or filter by department, asset category, or location.
How long does it take to set up the KPI dashboard for a city department?
Most public works teams are generating their first KPI reports within two weeks of onboarding. OxMaint's setup process includes asset import, PM schedule configuration, and crew onboarding — guided by a dedicated implementation specialist.
Your City Deserves Better Than Spreadsheet KPIs
OxMaint gives public works directors and city managers the analytics platform to run maintenance operations with data, not guesswork. Real KPIs, real accountability, real results.