A public works director tracking 340 separate metrics across facilities, fleet, and utilities isn't actually managing performance — the volume itself has become the problem. Council members ask about response time; the report shows preventive maintenance ratios. A budget hearing needs cost per lane mile; the dashboard surfaces work order backlog counts instead. This is a common pattern across mid-size city governments that grew their reporting piecemeal over a decade, adding a metric every time a new grant, audit, or council request demanded one, until nobody could say which numbers actually mattered. What follows is a composite walk-through — drawn from the pattern seen across similar municipal CMMS rollouts rather than a single named city — of how a metric-overloaded department typically narrows down to a workable set, and what changes once a connected maintenance platform replaces a patchwork of spreadsheets as the source of truth.
How One Mid-Size City Cut Metric Overload With a Connected CMMS
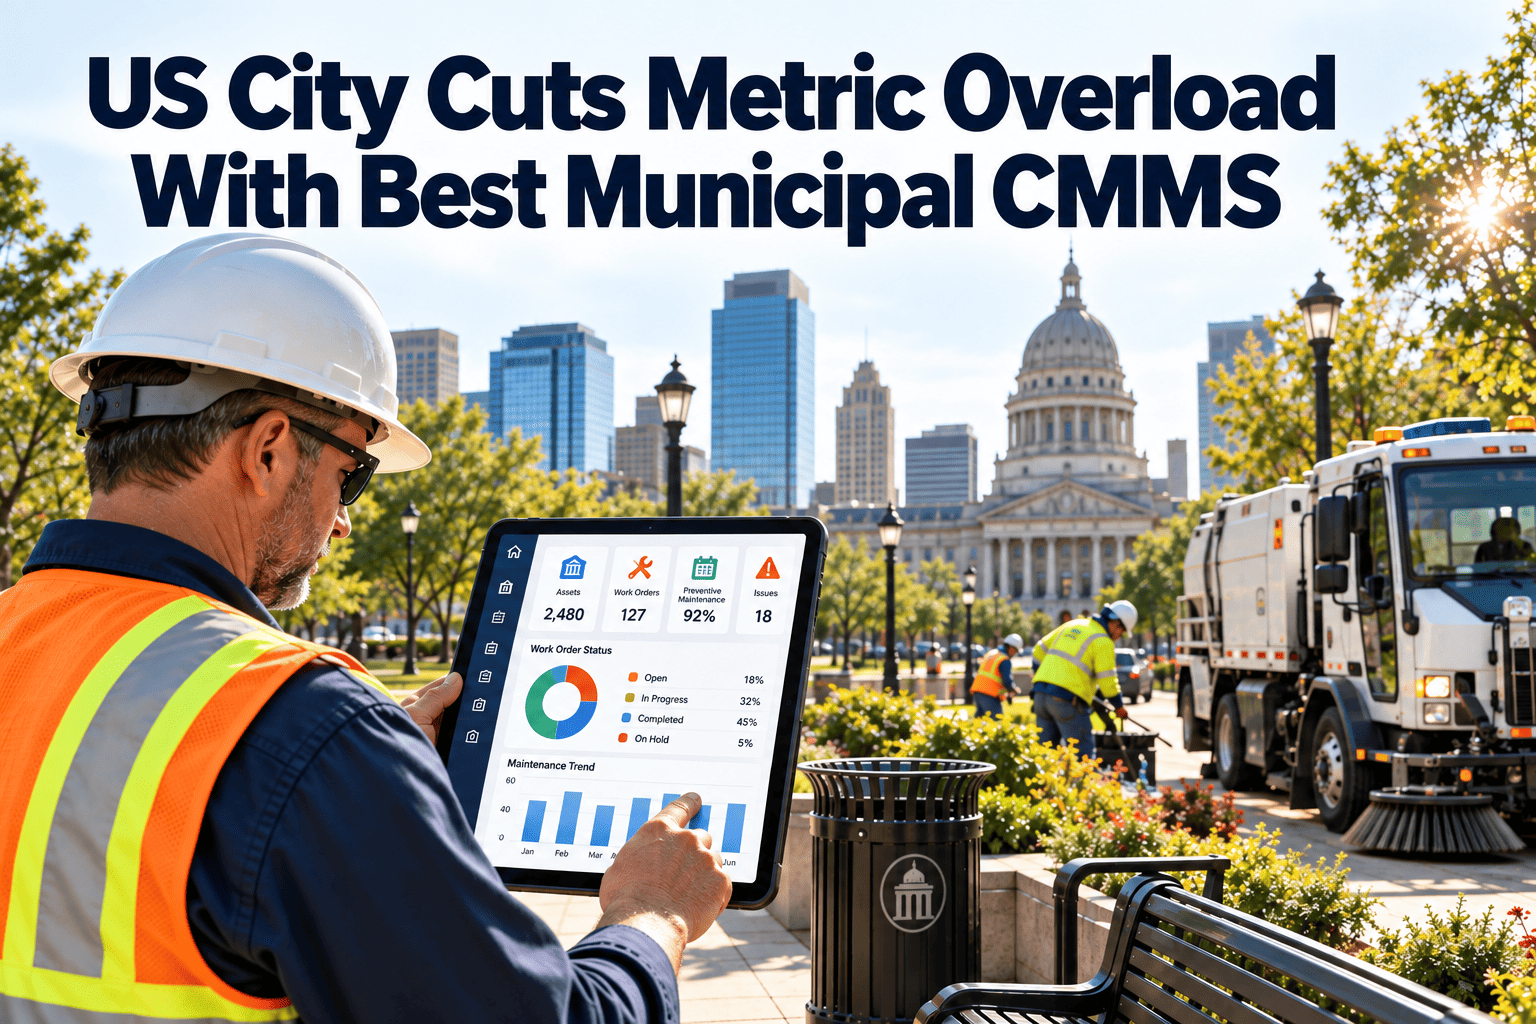
A composite illustration of a common transformation: a public works department drowning in 340 disconnected metrics narrows to 22 outcome-linked KPIs that council, department heads, and frontline crews all actually use.
The Starting Point: A Reporting System Nobody Fully Understood
By the time a metric audit gets triggered, the pattern usually looks similar across departments: a facilities division reporting one set of maintenance ratios, a fleet division tracking a different set of downtime figures, and a utilities division running its own compliance metrics — each built in a separate spreadsheet by a different analyst over a different budget cycle, none of them talking to each other.
The symptom that usually forces the issue isn't the metric count itself — it's a moment where two reports contradict each other in front of an audience that matters. A council presentation citing one fleet availability number, followed a week later by a budget office memo citing a different fleet availability number for the same period, tends to do more to trigger a consolidation project than any internal complaint about report volume ever does.
How the Number Got to 340
Metric growth like this rarely happens through a single decision — it accumulates. A state grant application requires three new reporting fields one year. An audit finding demands a new tracking metric the next. A council member asks a one-off question that turns into a standing monthly report. None of these additions gets reviewed against what already exists, and none gets retired once its original purpose has passed, so the total count only ever moves in one direction.
Compounding the problem, each new metric usually arrives with its own definition of common terms. One division's "downtime" counts only unplanned outages; another's includes scheduled maintenance windows. By the time a portfolio reaches a few hundred metrics, a term as basic as "backlog" might carry three or four subtly different meanings depending on which report someone happens to be reading — which is exactly the condition that makes a genuine department-to-department comparison impossible, no matter how much reporting effort goes into producing the numbers.
Mapping the Backlog Before Cutting Anything
The consolidation process typically starts with an inventory exercise rather than a cutting exercise — every existing metric gets logged with its source system, its owner, its stated purpose, and the last time anyone acted on it directly because of that number. This step alone tends to be revealing: a meaningful share of the original 340 usually turns out to have no identifiable owner still checking them, or a stated purpose tied to a program or grant that ended years earlier.
Why Reducing the Count Was the Hard Part, Not the Software
Consolidating metrics is a political exercise as much as a technical one. Every metric in the original 340 had an owner who requested it for a reason that felt legitimate at the time, and cutting it can feel like dismissing that reason. The departments that get through this step successfully tend to reframe the conversation around a single question for every candidate metric: does this number currently change a decision someone actually makes, or does it just get reported because it always has been?
Stop Reporting Everything to Everyone
OxMaint's dashboards let a single connected data set surface different views for council, department heads, and crew leads — without three separate spreadsheets pretending to be one system.
The Three-Tier Reporting Structure That Replaced the Spreadsheets
The 22 surviving metrics didn't collapse into one flat list — they split across three audiences, each seeing the depth of detail relevant to the decisions they actually make.
Each tier draws from the same underlying CMMS data set rather than a separately maintained report, which is what actually made the reduction durable. In the old spreadsheet model, a metric removed from one report often kept living on in someone else's file, quietly reintroducing the duplication the consolidation was meant to eliminate.
What Changed Operationally, Not Just on the Report
| What Matters | Before Consolidation | After Consolidation |
|---|---|---|
| Metric count | 340 across disconnected spreadsheets | 22 tiered, CMMS-sourced KPIs |
| Report preparation | Manually assembled each month | Generated on demand from live data |
| Council confidence | Numbers questioned, hard to verify source | Traceable back to individual work orders |
| Cross-department comparison | Not possible — different definitions per team | Standardized definitions across divisions |
| New metric requests | Added ad hoc, never retired | Reviewed against the same four-part criteria |
The Efficiency Case Behind the Consolidation
Reducing headline metrics from 340 to 22 is not, by itself, where the return on investment comes from — the value comes from what a smaller, trustworthy set of numbers lets a department actually do differently. Cities that complete this kind of consolidation commonly report that staff time previously spent assembling competing reports gets redirected toward acting on what the reports show, and that capital requests built on standardized, traceable KPIs move through council review with fewer rounds of clarifying questions than requests built on inconsistent legacy metrics.
Where the Time Actually Gets Saved
The largest recurring time cost in a 340-metric system isn't collecting the data — it's reconciling disagreements between two reports that were supposed to describe the same thing. When a fleet availability figure in one spreadsheet doesn't match the number in another, someone has to track down why before either number can be presented with confidence. A single connected data source removes that reconciliation step entirely, because there's only one place the number could have come from.
Frequently Asked Questions
Build a Reporting Structure Your Council Actually Trusts
OxMaint connects facilities, fleet, and utilities data into one source of truth, so your KPIs come from work orders and inspections instead of competing spreadsheets.