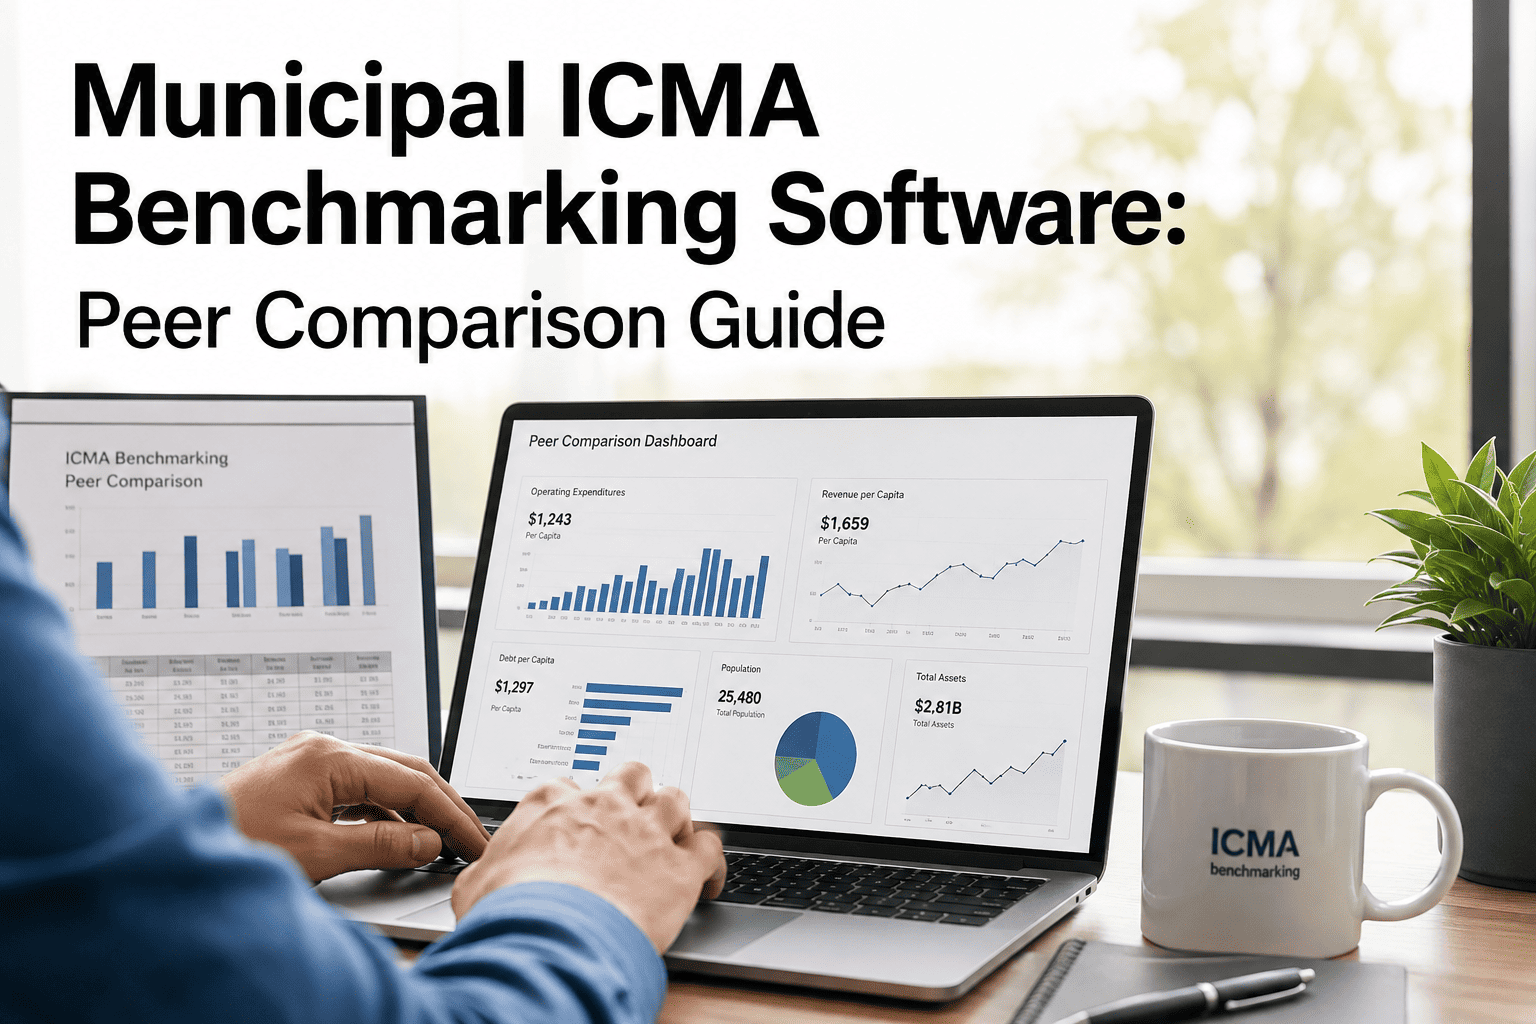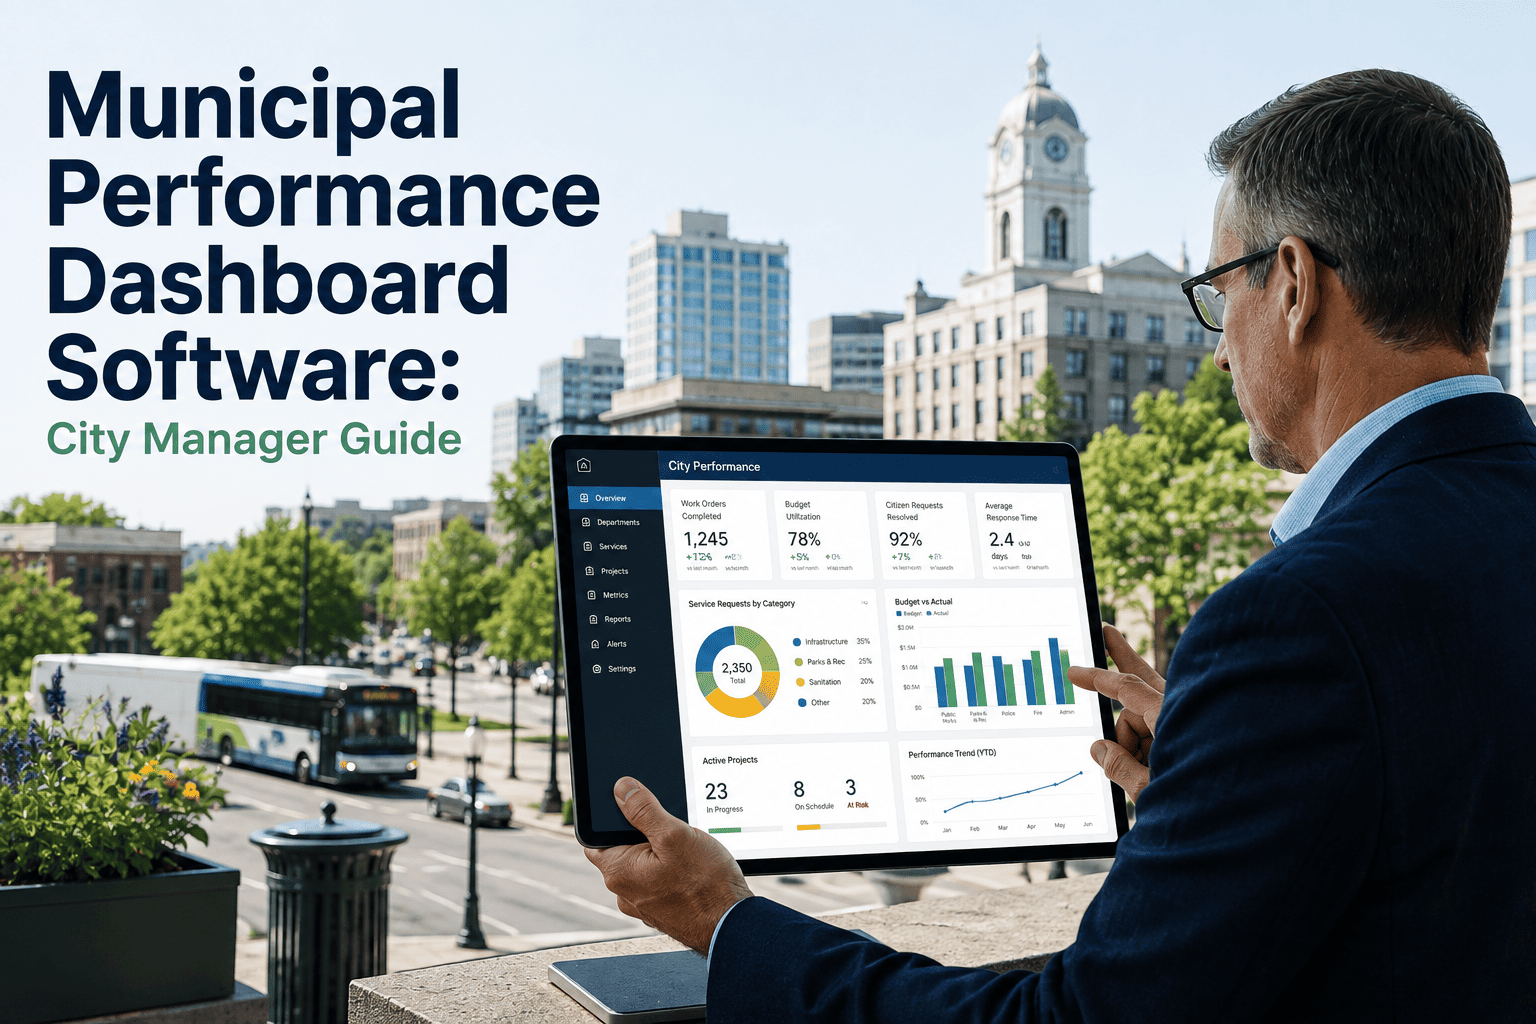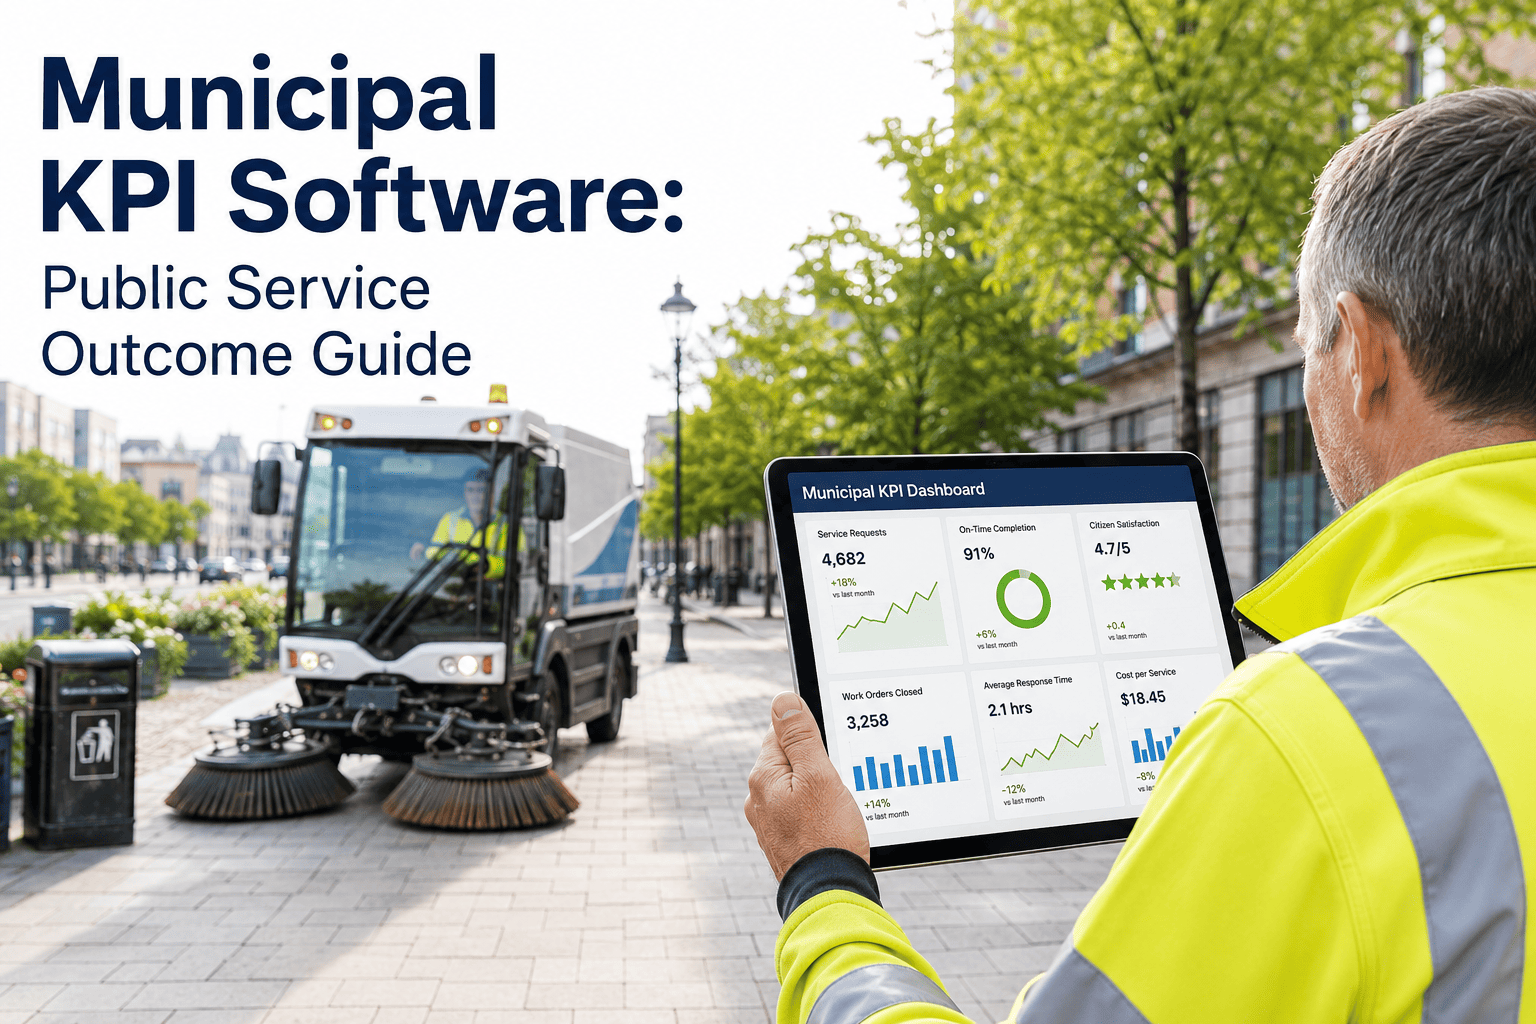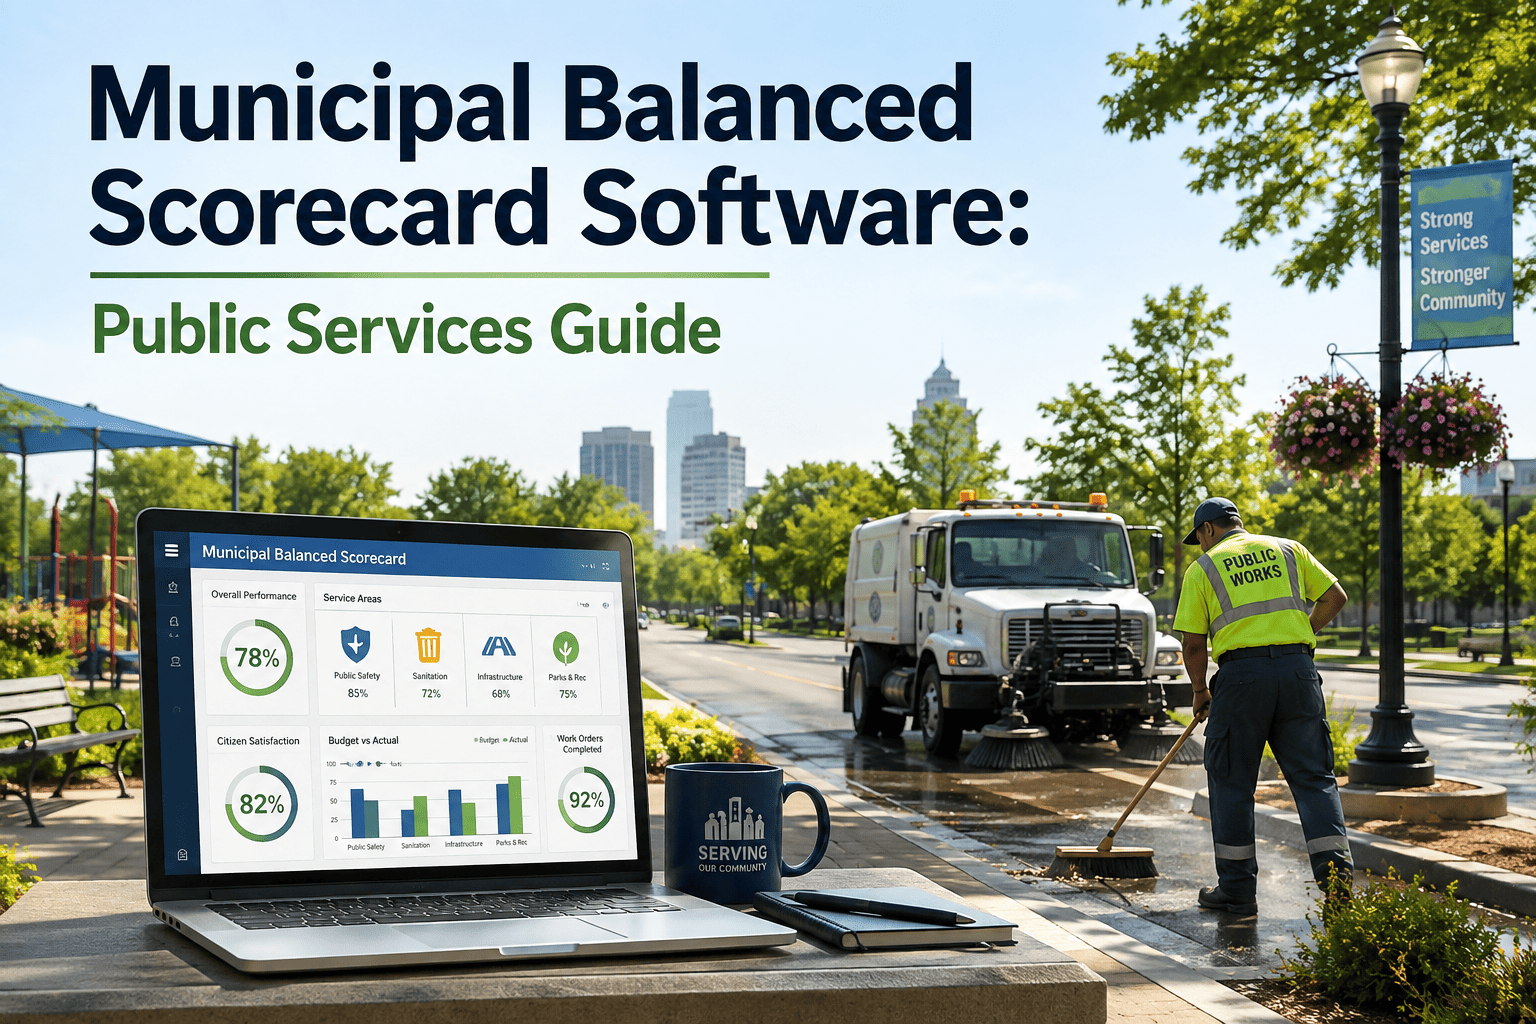
City managers evaluating performance often default to budget variance reports and departmental output counts — useful for accounting, but they say almost nothing about whether residents are actually better served day to day. A balanced scorecard closes that gap by tracking four connected perspectives at once: financial stewardship, resident satisfaction, internal process efficiency, and workforce learning, the same discipline ICMA recognition programs and high-performing local governments already lean on to move past single-metric reporting. Cities that adopt it stop reacting to complaints one issue at a time and start managing service delivery as a system, where a pothole repair delay, a permitting backlog, and a training gap on the streets crew show up on the same dashboard instead of three unrelated fires. Building that dashboard from spreadsheets alone breaks down fast once a city has more than a handful of departments reporting on different schedules. Sign in to OxMaint to see how a municipal balanced scorecard connects directly to live CMMS work order data instead of quarterly exports.
Municipal Balanced Scorecard Software for Public Services
A balanced scorecard gives council members, department heads, and residents one shared view of city performance across four perspectives — financial health, resident experience, internal process reliability, and staff capability — instead of four separate reports that never quite line up.
What Each Perspective Actually Measures in a City Government
A private-sector balanced scorecard was built around shareholders. A municipal version replaces that lens with the public mandate — but the discipline of tracking cause and effect across all four areas is what makes it more useful than any single KPI a council typically asks for.
What a City Needs to Stand Up a Municipal Balanced Scorecard
| Requirement | Purpose | Typical Source | Status |
|---|---|---|---|
| CMMS work order history | Feeds process and financial perspectives with real cycle time and cost data | Public works, water, facilities maintenance logs | Often existing |
| 311 or resident request system | Feeds resident experience perspective with resolution time and repeat issues | City call center or citizen portal | Often existing |
| Budget and finance system export | Feeds financial perspective with actual spend against planned capital budget | Finance department ERP | Integration required |
| HR training records | Feeds learning and growth perspective with certification and training coverage | HR or workforce development system | Manual import common |
| Scorecard dashboard layer | Combines all four perspectives into one council-facing view, refreshed automatically | OxMaint reporting layer | OxMaint native |
Stop Compiling the Scorecard by Hand Every Quarter
Manual scorecard compilation typically consumes two to four staff days per department every reporting cycle, and the numbers are already stale by the time council sees them. A CMMS-fed scorecard updates continuously instead.
Manual Quarterly Reporting vs a Live Scorecard
Most cities that come to me already have a strategic plan with performance goals written down somewhere in a binder from three years ago. What they don't have is a way to see, on any given Tuesday, whether this month's maintenance backlog is quietly working against one of those goals. A balanced scorecard only earns its name when all four perspectives are pulled from the same live operational data — otherwise it is just four separate reports stapled together, updated on four different schedules, and nobody trusts the number by the time it reaches council. The moment a city connects its work order system directly into the scorecard, the financial and process perspectives stop lagging behind reality, and that is usually when the resident experience numbers start improving too, because problems get caught while they are still cheap to fix.
Frequently Asked Questions
One Scorecard. Four Perspectives. Every Number Traceable to a Work Order.
OxMaint connects your city's financial, resident, process, and workforce data into a single balanced scorecard that updates as work gets done — not once a quarter when someone finally compiles the spreadsheet.