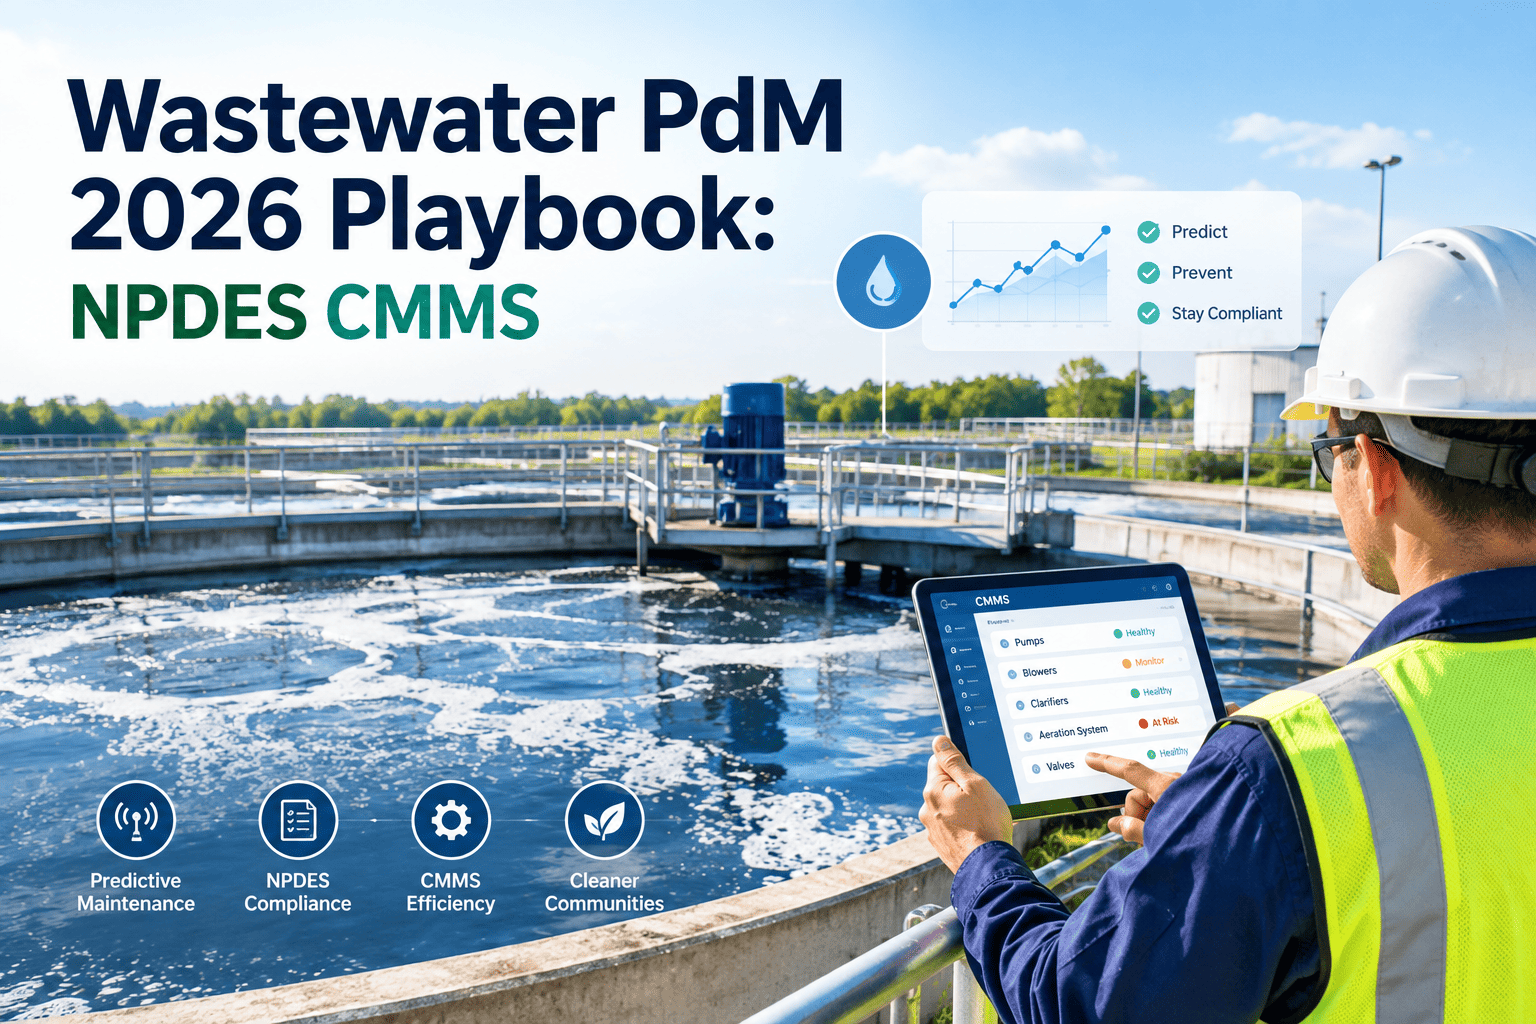
Wastewater PdM 2026 Playbook: NPDES CMMS

By Corin Hale on September 1, 2026

wastewater-pdm-2026-playbook-npdes-cmms

A wastewater treatment plant rarely fails on the org chart — it fails when a blower bearing overheats three weeks before budget review, when a UV sleeve fouls past its transmittance threshold during a wet-weather event, or when a digester mixer trips at 2 a.m. with nobody watching the SCADA screen. Each of those moments either becomes an NPDES permit violation on next month's discharge monitoring report or an emergency call-out that pulls a technician off a planned job. Predictive maintenance closes that gap by reading the plant's own instrumentation — dissolved oxygen, MLSS, torque, UV intensity, vibration — before a threshold turns into a violation, and pairing every reading with a documented, auditable action. This playbook lays out a complete 2026 PdM framework for every major wastewater asset class, plus the CMMS template that keeps it running the same way on every shift, inside the OxMaint platform plants use to turn permit compliance into a routine byproduct of daily operations rather than a monthly scramble.

Wastewater Operations · Predictive Maintenance · NPDES

The 2026 Wastewater Plant PdM Playbook & CMMS Template

A condition-based maintenance framework for aeration, clarifiers, sludge and digesters, UV disinfection, and lift stations — built so every sensor reading, threshold breach, and corrective action lands in one CMMS record your next NPDES inspection can be built from in minutes, not weeks.

6 Asset Classes Covered
45+ PdM Checkpoints
$25K Max Daily NPDES Fine
24 mo Violation Record Lifespan
Reactive vs. Predictive: What Changes on the Plant Floor

Most plants do not lack maintenance effort — they lack a system that turns a sensor reading into a scheduled action before the reading becomes a discharge monitoring exception. The gap between reactive and predictive operation shows up in four places every operations manager already tracks.

Unplanned Downtime
Reactive: frequent, unscheduled
Predictive: scheduled around load
Effluent Excursions
Reactive: discovered at the DMR
Predictive: caught at the sensor
Repair Cost per Incident
Reactive: full failure, rush parts
Predictive: planned component swap
Audit Preparation Time
Reactive: weeks of log compilation
Predictive: exportable in minutes
How the Playbook Runs Inside a CMMS, Step by Step
1 Sensor Reads DO, torque, vibration, UV intensity, and level data stream in from plant instrumentation or manual rounds
2 Threshold Check Each reading is compared against the asset's normal operating band set in the CMMS
3 Work Order Fires A breach auto-generates a work order routed to the technician on shift, before failure occurs
4 Action Logged The technician's corrective action, parts used, and sign-off are captured against the asset record
5 Compliance Record The same entry becomes the timestamped evidence your NPDES DMR and inspection file draw from
DDaily / Per-Shift
WWeekly
MMonthly
QQuarterly
AAnnual
Asset Class 01

Aeration Basins & Blowers

Aeration is the single largest energy draw at most plants and the process most directly tied to ammonia and BOD limits. A blower that drifts off its curve does not trip an alarm — it just quietly starves the basin of dissolved oxygen until nitrification stops working and effluent ammonia climbs past the permit limit days later. Diffuser fouling behaves the same way: gradual, invisible from the catwalk, and expensive once it shows up as an oxygen transfer deficit.

Dissolved Oxygen1.5 – 3.0 mg/L
Blower VibrationBelow 0.3 in/sec
Bearing TemperatureUnder 180°F
Blower Amp DrawWithin 5% of baseline
DDO probe readings compared against handheld reference; probes drifting more than 0.3 mg/L from reference flagged for cleaning or recalibration before the shift ends
WBlower vibration and bearing temperature trended against baseline; a rising trend over three consecutive readings is scheduled for bearing inspection before it becomes a bearing failure
WInlet air filters and silencers inspected for restriction; a filter loading up increases blower amp draw and energy cost long before it trips a high-temperature shutdown
MDiffuser fouling assessed through oxygen transfer efficiency testing or visual grid inspection during a basin drain-down; fouled diffusers are cleaned or replaced on a rotating schedule, not all at once
QBlower gearbox oil sampled and analysed for particulate and moisture content; results logged against the asset to build a wear trend across the blower's service life
Asset Class 02

Clarifiers, RAS & WAS Systems

A secondary clarifier failing quietly looks like a rising sludge blanket, a rake arm drawing more torque than usual, or a return activated sludge pump that has started cycling harder to move the same flow. None of these trip an alarm on their own — they show up together as effluent total suspended solids creeping upward over a week, by which point the plant is already reacting instead of adjusting.

Sludge Blanket DepthBelow 1/3 of side water depth
Rake Arm TorqueWithin design rating
RAS Pump Amp DrawWithin 5% of baseline
Effluent TurbidityBelow permit trigger
DSludge blanket depth measured with a sludge judge or ultrasonic sensor at each clarifier; a rising blanket trend triggers a RAS rate adjustment before solids carry over the weir
DEffluent weir and launder inspected for algae growth or uneven flow distribution, which causes localized short-circuiting and hides a developing solids loading problem
WRake arm drive torque and RAS pump amp draw trended together; a torque increase without a corresponding blanket depth increase usually points to mechanical drag, not a process issue
MScum removal mechanism and skimmer function tested through a full cycle; a scum trough that does not clear allows floatables to carry into the effluent channel undetected
QWAS pump wear components inspected and flow-tested against design capacity; a WAS pump losing capacity slowly changes solids retention time without any single alarm firing
Asset Class 03

Sludge Handling & Anaerobic Digesters

A digester is a biological process running inside a steel tank, and the maintenance signals are chemical as often as they are mechanical. A mixer drawing rising amperage against a falling gas production rate is not two separate problems — it is one digester slowly souring, and the fix is completely different depending on whether the cause is mechanical fouling or a volatile acid imbalance.

Digester Temperature95 – 100°F mesophilic
VFA / Alkalinity RatioBelow 0.3
Mixer Amp DrawWithin 5% of baseline
Gas ProductionStable per lb VS destroyed
DDigester temperature and gas flow logged and compared against the previous week's trend; a temperature drop of more than 2°F is investigated the same shift, not at the next round
WVFA to alkalinity ratio sampled and tested; a ratio trending toward 0.3 signals early souring and is corrected with feed rate adjustment before it requires a full digester recovery
WMixer amp draw trended against gas production; rising amp draw with falling gas output points to rag or grit buildup on the mixer impeller requiring a scheduled cleaning
MSludge heat exchanger inspected for scaling and fouling; a fouled exchanger forces the boiler to work harder to hold digester temperature, raising both fuel cost and failure risk
QFoam level and gas storage sensors calibrated and function-tested; an uncalibrated foam sensor is one of the most common causes of an undetected digester foam-over event

A missed blower vibration trend or an uncalibrated DO probe rarely shows up as a mechanical failure first — it shows up as an ammonia or TSS exceedance on next month's discharge monitoring report. OxMaint turns every sensor threshold in this playbook into an automatic work order, and every completed work order into an audit-ready compliance record your team can pull up before an inspector finishes walking in the gate.

Asset Class 04

UV Disinfection Systems

UV disinfection is the last barrier before discharge, which makes it the least forgiving system on the plant to run reactively. A fouled quartz sleeve reduces UV transmittance gradually enough that dose delivery can fall below the validated level for days before a low-intensity alarm ever fires, and by then the plant may already be out of compliance on fecal coliform or E. coli limits without anyone knowing until the lab results return.

UV IntensityAbove validated setpoint
Sleeve TransmittanceWithin 10% of clean baseline
Lamp HoursBelow rated lamp life
Ballast TemperatureWithin manufacturer range
DUV intensity sensor readings logged against the validated dose setpoint for the current flow rate; any reading approaching the low-dose alarm threshold triggers an immediate sleeve check
WAutomatic sleeve wiper mechanism cycle-tested to confirm full stroke travel; a wiper that stops short leaves a fouled band on the sleeve that the sensor cannot always detect early
MLamp hours reviewed against rated life and replacement scheduled proactively in banks rather than lamp by lamp, which keeps dose delivery consistent across the full channel
MBallast enclosure temperature and cooling fan function checked; an overheating ballast is one of the leading causes of unplanned UV bank shutdown during summer flow peaks
QUV intensity sensor recalibrated against a certified reference sensor; sensor drift left uncorrected can mask a genuine dose deficiency for months at a time
Asset Class 05

Lift Stations & Wet Wells

Lift stations fail in the field, unattended, usually at night, and a failed station does not just cost a repair bill — it risks a sanitary sewer overflow that carries its own separate reporting obligation under the NPDES program. Pump amp draw, wet well level trending, and float switch function are the three signals that catch a station drifting toward failure while there is still time to schedule the fix during business hours instead of responding to it at 3 a.m.

Pump Amp DrawWithin 5% of baseline
Wet Well LevelWithin normal cycle band
Pump VibrationBelow 0.3 in/sec
H2S ConcentrationBelow odor control trigger
DPump run hours, cycle count, and amp draw pulled from SCADA and compared against baseline; a rising cycle count with falling wet well drawdown time signals a pump losing capacity
WWet well level sensor and backup float switches function-tested independently; a station relying on a single working level signal has no warning before a high-level overflow event
WCheck valves inspected for slam or backflow, which accelerates pump wear and can be heard as a hammering sound at each pump shutdown cycle
MStandby generator or transfer switch load-tested at each unmanned station; a station that loses power without a verified backup is one storm event away from an unpermitted overflow
QWet well cleaned of rag and grit accumulation, and odor control H2S sensors recalibrated; grease and rag buildup is the leading mechanical cause of pump clogging between scheduled visits
Compliance Layer

NPDES Documentation the CMMS Should Generate Automatically

Every checkpoint above only counts as compliance evidence if it is timestamped, attributed to a technician, and retrievable without a manual search through paper logs. This is the layer that turns a maintenance program into a defensible NPDES compliance record.

DEvery threshold breach and corrective action logged against the specific asset ID, with technician name, timestamp, and reading captured automatically at the point of completion
MInstrument calibration records for DO probes, UV sensors, and flow meters compiled into a single exportable file matching the format expected by state primacy agencies
MAny bypass, overflow, or permit deviation event linked directly to the maintenance record that explains the cause, which is the single most requested item during a compliance review
AAnnual and permit-cycle documentation retained on a schedule that matches the 24-month Vehicle and Process Maintenance record window most state agencies expect to review on request
Playbook Outcomes

What Changes When the Playbook Runs in a CMMS Instead of a Binder

Metric Reactive Approach Predictive Playbook
Blower or pump failure detection Discovered at shutdown Flagged at trend deviation
Effluent exceedance discovery Found on the DMR Caught at the sensor
DMR and audit preparation Weeks of manual log pulls Exported in minutes
Emergency call-outs per quarter High and unscheduled Reduced and scheduled
Calibration record retrieval Manual binder search Searchable by asset ID
Common Questions

Frequently Asked Questions

What does predictive maintenance actually mean for a wastewater plant?

It means scheduling work based on what a blower, pump, or UV sensor is actually reporting — vibration, torque, amp draw, dose intensity — instead of waiting for a fixed calendar date or a failure. A CMMS built for this turns each reading into a threshold check and, when needed, an automatic work order.

How does this playbook connect to NPDES permit compliance?

Most permit exceedances trace back to a mechanical or process drift that went unnoticed for days, such as a fouled UV sleeve or a drifting DO probe. Catching that drift early through PdM checkpoints, and logging the correction, is what turns a maintenance record into usable compliance evidence.

Which assets should a plant prioritize first if it is starting from zero?

Aeration blowers and UV disinfection typically deliver the fastest payback, since both sit directly upstream of permit limits and both fail gradually in ways a daily reading can catch well before a lab result would.

Do small and mid-size plants need the same level of instrumentation as large plants?

No — many of the checkpoints in this playbook, such as sludge blanket depth or amp draw trending, work with a handheld meter and a manual log just as well as with continuous SCADA feeds. The CMMS structure matters more than the sensor budget.

Can a CMMS generate discharge monitoring report documentation automatically?

Yes, when every calibration, threshold breach, and corrective action is logged against the asset at the time it happens, that same data can be exported directly into the format state agencies expect. See it configured for your plant in a live walkthrough.

Get the Full Playbook Running

Every Asset Monitored. Every Threshold Logged. Every DMR Ready.

OxMaint turns this playbook into a live CMMS workflow across aeration, clarifiers, digesters, UV disinfection, and lift stations — with automatic work orders, calibration tracking, and one-click NPDES-ready compliance exports for your next inspection.


Share This Story, Choose Your Platform!