Every winter a mid-sized utility can log 30 to 60 main breaks, each one costing five to ten times more in emergency response than the same repair would cost under a planned capital program. The good news is that the data needed to forecast those failures already exists in your GIS, work-order, and asset records — it just has not been scored yet. This guide walks municipal engineers and operations directors through break-history analysis, pipe risk scoring, condition-assessment integration, and the predictive replacement pipeline that turns monthly emergencies into managed capital. Start your Start Free Trial to see your own break-risk dashboard this week.
Can you predict the next main break before the street floods?
A single 8-inch cast-iron failure averages $50K in emergency repair, lane closures, and boil-water notices. Predictive break analysis now runs on a utility laptop for less than the cost of one emergency crew callout — turning monthly breaks into a ranked capital pipeline.
main replacement cost ratio
Why reactive main repair quietly drains your capital budget
The U.S. sees roughly 250,000 water main breaks every year, losing an estimated 2.1 trillion gallons of treated water. For a 200-mile system averaging 40 breaks annually, the math is brutal — and almost entirely avoidable.
Scoring every pipe segment for break probability
Predictive replacement starts by assigning each pipe segment a 0–100 risk score built from the four failure drivers below. Segments scoring above 70 move into the annual replacement queue; 50–70 go into condition assessment; below 50 stays in routine monitoring.
Pipe age & material
Cast iron installed before 1960 and asbestos-cement from the 1970s carry the highest historical break rates. Polywrap ductile iron post-1990 ranks lowest.
Break history density
Segments with two or more prior breaks in a five-year window fail again at 3× the baseline rate. Clustering within 500 ft signals regional pressure or soil stress.
Operating pressure
Sustained pressure above 80 psi or daily cycles greater than 15 psi accelerate fatigue cracking, especially on thinner-wall legacy mains.
Soil & environment
Corrosive clay soils, frost zones, and traffic-loaded corridors double external corrosion rates. GIS soil overlays flag hotspots in minutes.
After scoring 8,400 segments, 63 pipes landed in the 70+ band — 11 miles of cast iron under a corrosive-clay corridor. Targeted replacement over two cut years broke the cycle: Year 1 breaks dropped to 28, Year 2 to 19. Reactive spend fell to $950K; the capital program paid back inside 26 months and freed crew hours for proactive valve and hydrant work.
Reactive repair vs. predictive replacement
The gap between break-of-the-day operations and a ranked replacement pipeline is not about more budget — it is about spending the same dollars earlier, on the right pipes, on your schedule.
| Dimension | Reactive repair program | Predictive replacement program |
|---|---|---|
| Cost per mile | $1.2M–$2.0M emergency (5–10× premium) | $400K–$650K planned CIP replacement |
| Outage duration | 6–8 hr average, customer-facing | Scheduled, often zero outage via bypass |
| Boil-water notices | Frequent, regulatory & reputational cost | Rare; planned disinfection protocol |
| Crew utilization | 70% on emergency callouts, heavy OT | 85% on scheduled capital work, flat OT |
| Capital predictability | Volatile, board-driven spikes | 5-year ranked pipeline, smoothed spend |
| Non-revenue water | Rising — unreported leaks mask failures | Falling — monitoring catches losses early |
From data audit to ranked pipeline in 90 days
A mid-size utility does not need a multi-year integration. Most teams reach a scored, ranked replacement queue inside one quarter using existing GIS, CMMS, and billing records.
Data audit & break history load
Pull 10 years of work orders, GIS geometry, install dates, materials, and pressure-zone logs. Normalize material codes and geocode every break to its segment. Target 95% asset coverage before scoring begins.
Risk scoring & field validation
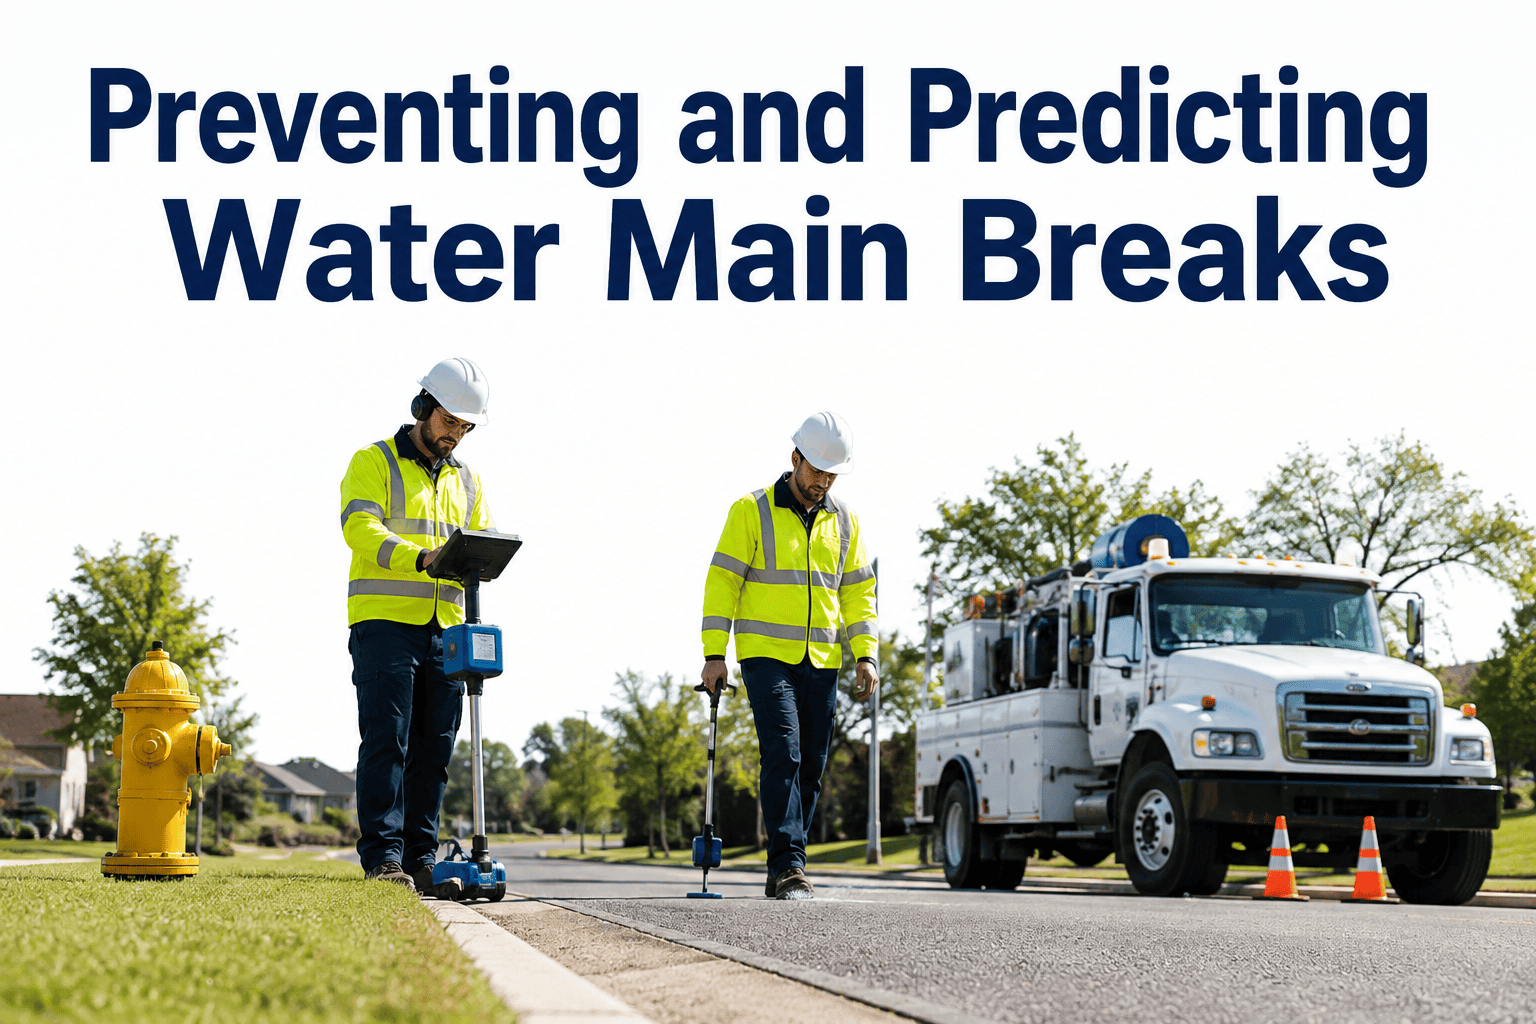
Run the 0–100 model, then field-verify the top 20 segments with acoustic leak detection or CCTV. Calibration against actual condition catches edge cases and tunes weights to your soil and pressure profile.
Ranked pipeline & CIP integration
Publish the replacement queue by risk, by neighborhood, and by mutual-support cost. Fold the top 5–8 miles into the capital plan with staged funding, bypass design, and customer-notice templates ready to deploy.
Stop paying 5–10× for the same repair.
Load your break history today and walk into the next board meeting with a ranked, cost-justified replacement plan.
Validating risk scores before you dig
A risk score tells you where to look. Condition assessment tells you whether to dig now or wait. Layer these techniques onto your 50+ scored segments to confirm replacement order and avoid spending capital on pipes that still have service life.
Acoustic leak detection
Sensors listen for leak noise on valves and hydrants. Cost-effective for cast-iron networks; flags active leaks weeks before they surface. Deploy in 500-ft spacing on 60+ risk pipes.
CCTV internal inspection
Best for mains 12-inch and above. Identifies joint displacement, tuberculation, and wall loss. Use on trunk-feed segments where failure impact is highest and bypass is hardest.
Pressure transient logging
High-rate loggers capture surge events that fatigue older mains. Two-week deployments catch pump starts, valve slams, and fire-flow spikes invisible to SCADA averages.
Soil corrosivity testing
Resistivity and pH testing at hotspot segments confirms external corrosion risk. Cheap per test; invaluable for prioritizing cathodic protection versus full replacement.
Hydraulic model cross-check
Cross-reference risk scores with EPANET models to see which segments carry the most critical demand. A high-risk, high-criticality pipe jumps to the top of the replacement queue.
Satellite leak scanning
L-band radar from orbit detects soil moisture anomalies above buried mains — a low-cost triage for large, rural, or low-density service areas where acoustic coverage is impractical.
Water main break prevention, answered
How much break history do we need before predictive scoring works?
A minimum of five years of geocoded work orders gives the model enough failure events to find patterns. Ten years is better — it smooths out weather anomalies and captures the full break-density signal. If your records are thin, start by geocoding every break for the past 24 months and grow the dataset from there.
What is the typical payback period for a predictive replacement program?
Most mid-size utilities see payback inside 18–30 months. The savings come from three places: lower per-mile cost on planned replacements, reduced emergency overtime, and fewer boil-water notices and property claims. You can Start Free Trial and run your own numbers with our break-cost calculator.
Can predictive scoring work for asbestos-cement and PVC mains, not just cast iron?
Yes. The model weights material differently — cast iron leans on age and corrosion; asbestos-cement leans on break density and soil chemistry; PVC leans on pressure transients and joint integrity. The scoring engine handles all common materials, and the weights tune to your system during calibration.
How do we fund the replacement pipeline once it is ranked?
A ranked pipeline strengthens every funding application. Use it for SRF revolving-fund submissions, EPA DWSRF infrastructure grants, rate-case justification, and bonding capacity. Utilities that bring a scored, prioritized list to board meetings typically secure capital approval 40% faster than those presenting ad-hoc requests.
Does this replace our existing CMMS or GIS?
No — it sits on top of them. The scoring engine reads from your GIS geometry, CMMS work orders, and SCADA pressure logs, then writes the risk score and replacement rank back to your asset records. Nothing is duplicated; your crews keep using the tools they already know. Want to see the integration? Book a Demo.
Forecast the next break. Plan the fix. Save the budget.
Load your asset and break data, get a scored replacement queue, and stop writing emergency-repair checks that cost five to ten times more than they should.
Free 14-day trial · No credit card