A roof repair deferred this fiscal year rarely stays a roof repair. By the time it resurfaces in next year's budget request, water intrusion has damaged insulation, warped a ceiling grid, and started corroding electrical conduit above it — and the number attached to the request has grown well past what a single line item covers. Public agencies rarely lose maintenance budgets to one dramatic failure; they lose them one quietly compounding line item at a time, repeated across dozens of buildings and hundreds of assets. This piece walks through why that compounding happens on a predictable schedule, how a Facility Condition Index and a Repair Priority Index turn the pattern into something a budget office can act on before it accelerates, and where a connected CMMS breaks the cycle instead of documenting it after the fact.
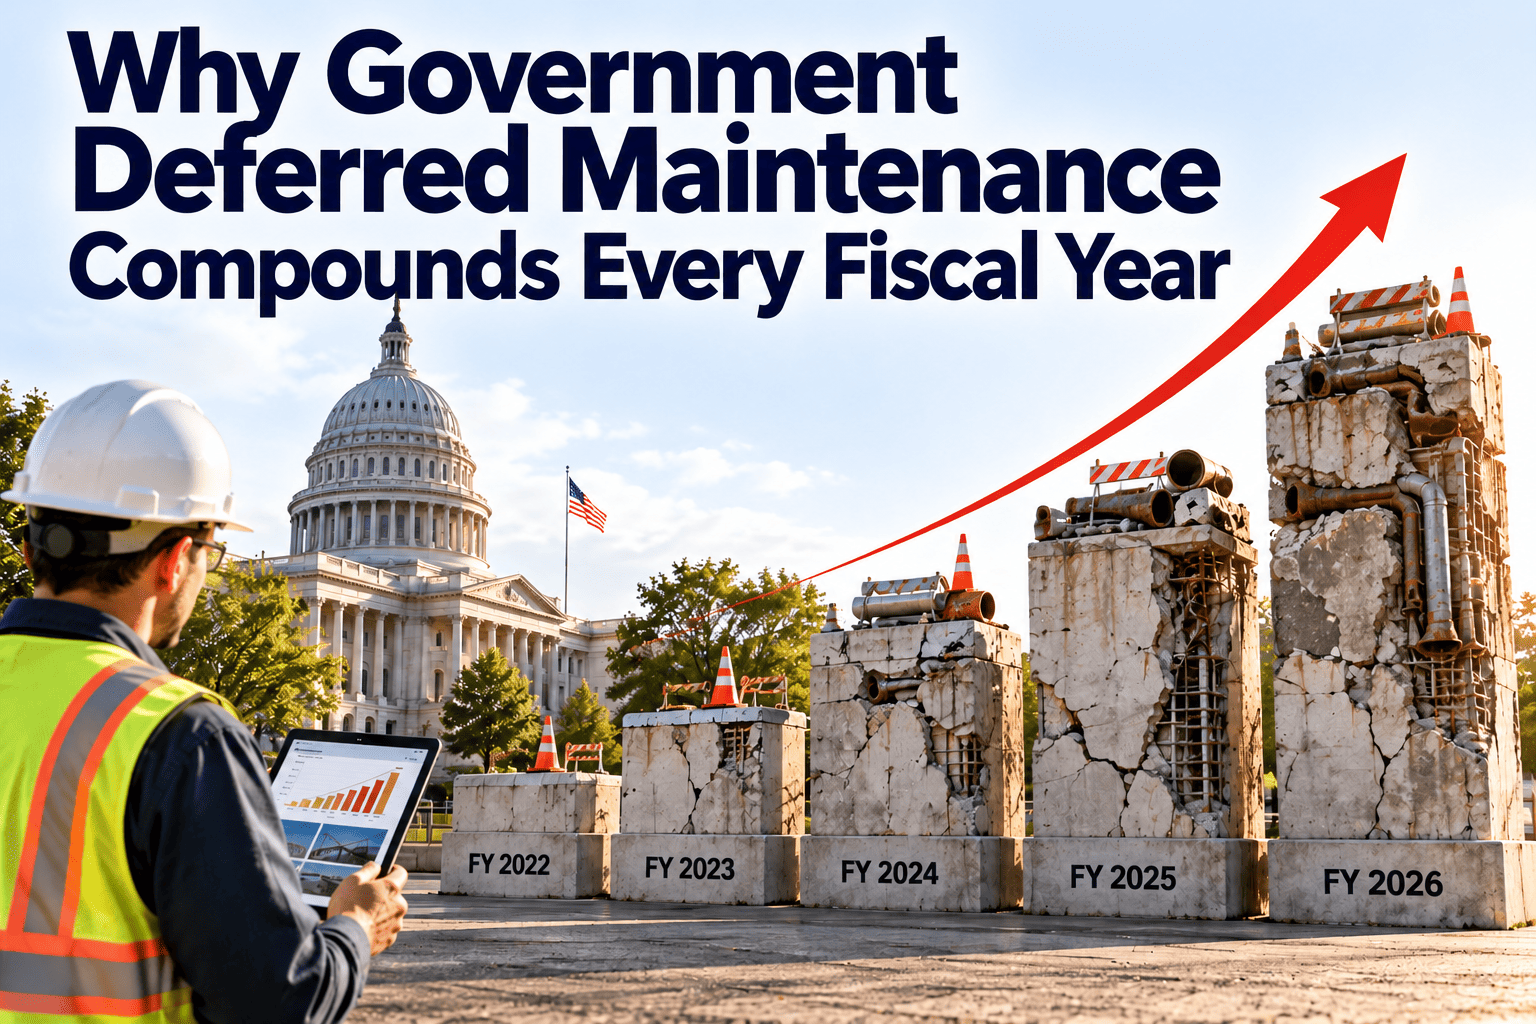
Why Government Deferred Maintenance Compounds Every Fiscal Year
A deferred repair doesn't sit still between budget cycles — it grows, at a rate most agencies have never actually measured. This guide breaks down the compounding math, the appropriation cycle that lets it continue, and the condition-data framework that finally interrupts it.
The Backlog Nobody Budgeted For
Combined deferred maintenance backlogs across U.S. federal, state, municipal, and school facilities now exceed one trillion dollars. That figure didn't arrive as a single bad year — it accumulated silently, one tabled repair request at a time, across agencies that treat deferred maintenance as a line item rather than a compounding liability.
A National Total, Built From Local Decisions
The trillion-dollar figure is a national total, but the mechanism behind it plays out identically at the scale of a single county public works department or a single school district. A handful of items get deferred this year because the budget didn't stretch far enough. Next year, those same items are back, joined by whatever else fell out of the maintenance cycle in the meantime — and the department is now negotiating for a larger number with the same limited pool of capital funding competing against it.
What "Compounding" Actually Means Here
Once a facility deficiency drops out of a planned maintenance cycle, its underlying deterioration doesn't pause while it waits for next year's budget conversation. A cracked membrane roof keeps admitting water. A corroding pipe keeps corroding. Industry cost-escalation modeling commonly applies a compounding rate of roughly 7% annually to an unaddressed deferred item — meaning a repair estimated at $500,000 today becomes a meaningfully larger obligation five years from now, without a single additional square foot of damage being added intentionally by anyone.
That projection assumes the item is discovered and repaired on a planned schedule at each point along the way. In practice, a meaningful share of deferred items never get a planned repair at all — they run to failure, at which point the relevant comparison isn't the compounded planned-repair estimate but the emergency replacement cost, which is commonly cited at four to eight times higher than the same work completed on a planned timeline.
Where Compounding Shows Up Fastest
Not every deferred item deteriorates at the same rate. Building envelope failures — roofing, waterproofing, window seals — tend to compound the fastest once water intrusion begins, because moisture damage spreads to adjacent materials that weren't part of the original deficiency. HVAC and mechanical items often degrade closer to a straight line, with cost increasing mainly through lost efficiency and a growing risk of full system failure rather than secondary damage. Life-safety systems compound differently again: the dollar cost may stay flat for years, but the regulatory and liability exposure grows every day the deficiency remains open, which is why most Repair Priority Index frameworks weight life-safety items independently of pure cost escalation.
Four Reasons the Cycle Keeps Repeating
Each of these four causes reinforces the other three. A request without evidence loses to whichever building's advocate spoke up loudest, the loudest advocate isn't necessarily managing the fastest-compounding asset, the resulting emergency repair consumes budget that would have funded planned work elsewhere, and the agency ends the year with less visibility into its compounding rate than it started with — not more.
Which Cause to Fix First
Breaking any single one of these four causes weakens the whole cycle, but breaking the first — arriving with evidence instead of urgency — tends to have the largest downstream effect, because it's the one that gives a committee a reason to engage with the ranking and the cost trajectory in the first place rather than defaulting to a deferral.
Stop Re-Litigating the Same Repair Every Budget Cycle
OxMaint tracks deferred items with a live condition score and a compounding cost projection attached, so a repair tabled this year arrives at next year's committee meeting with a documented, larger number — not a repeat of the same request.
The Two Scores That Turn a Backlog Into a Budget Argument
Two figures do most of the work in a defensible capital request: the Facility Condition Index, which expresses a building's overall deferred backlog against its replacement value, and the Repair Priority Index, which ranks individual deferred items against each other by urgency rather than dollar size alone.
Neither score is useful as a one-time calculation. A backlog quantified once and never revisited is exactly the static snapshot that let the original problem compound in the first place — the value of both scores comes from recalculating them continuously as deficiencies are logged and repairs close out in the CMMS.
The Four Inputs Behind a Repair Priority Index Score
A defensible RPI score isn't a single number pulled from intuition — it's a weighted combination of factors that a capital committee can trace back to its source. Safety risk asks whether the deficiency threatens occupants or the public directly. Regulatory exposure flags anything tied to a code requirement, permit condition, or compliance deadline. Compounding cost rate estimates how quickly the dollar figure is growing if the item stays deferred. Cascade potential captures whether this deficiency is likely to damage or accelerate the failure of an adjacent system if left unaddressed. A roof leak scores high on compounding rate and cascade potential; a missing fire door scores high on safety and regulatory exposure even at a comparatively low repair cost — which is exactly why ranking by dollar amount alone gets the priority order wrong. Agencies that skip this weighting and simply sort a spreadsheet by cost tend to fund the largest projects first, regardless of urgency, which is often the opposite of the order a risk-aware capital plan should follow.
The Annual Appropriation Cycle — Where the Break Has to Happen
Step three is the point where a data-backed request changes the outcome. A capital packet built from live FCI scores, a ranked RPI list, and a cost-escalation projection gives a committee something concrete to approve rather than something to defer — because the alternative, spelled out in dollars, is now visible on the same page as the request.
Phased Funding Becomes an Option, Not a Stall
This is also where phased funding tends to enter the conversation productively rather than as a stalling tactic. A committee unwilling to approve a full $980,000 renovation might approve $300,000 toward the highest-RPI portion of the same project this cycle, with the balance scheduled for the following year — a decision that only makes sense once the ranked breakdown of the project exists to be split in the first place. Static backlog totals rarely support that kind of partial approval, because there's no defensible way to say which third of an undifferentiated dollar figure matters most.
Stuck in the Cycle vs. Breaking It
| What Happens | Static Backlog Tracking | Condition-Data-Driven Tracking |
|---|---|---|
| Cost escalation | Invisible until the item fails | Projected and shown at request time |
| Prioritization | Whoever asks loudest, or most recently | Ranked by safety, cost rate, and risk |
| Committee confidence | Depends on trust in the requester | Backed by verifiable condition scores |
| Emergency spending | Consumes planned capital unpredictably | Reduced as backlog items are addressed early |
| Multi-year visibility | Rebuilt from scratch each cycle | Carried forward automatically |
What Changes in the First Full Budget Cycle
Agencies that move from static backlog spreadsheets to continuously scored FCI and RPI tracking rarely see the total backlog shrink overnight — the deferred work still has to get funded and completed on its own timeline. What changes first is the conversation itself. A capital request built from live condition data gives finance staff a document they can independently verify rather than one they have to take on trust, and that shift alone tends to move more items from "tabled" to "approved, phased over two cycles" in the very first budget season a portfolio runs this way.
The Reporting Side Matters as Much as the Scoring
A ranked priority list only helps if it reaches the people making funding decisions in a format they can act on. That means exporting FCI trends, RPI rankings, and cost-escalation projections into whatever format a specific committee, council, or board already reviews — a dashboard for staff-level planning conversations, and a summarized packet for the public meeting where the actual vote happens. Agencies that build this reporting step into the CMMS workflow from the start avoid the common failure mode where excellent condition data exists but never makes it in front of the people who control the appropriation.
Getting Started Without a Full System Overhaul
Most agencies don't need to replace their entire maintenance process to begin scoring FCI and RPI — they need their existing inspection findings, work order history, and the most recent facility condition assessment loaded into one connected system that can calculate both scores automatically and keep them current as new work is logged. The full appropriation-cycle benefit compounds the same way the backlog does: the earlier a portfolio starts tracking condition data continuously, the more budget cycles it has to compare against before the next capital plan is due.
Frequently Asked Questions
Bring Next Year's Budget Meeting Evidence, Not a Repeat Request
OxMaint keeps FCI and RPI scores current as work orders close, so every deferred item arrives at appropriation season with a documented cost trajectory attached.