Hospital maintenance teams across the USA, UK, Australia, UAE, and Germany are under mounting pressure — aging infrastructure, tighter compliance mandates, and shrinking budgets colliding simultaneously. Yet the highest-performing health systems consistently outperform on every operational metric by doing one thing differently: they measure relentlessly and benchmark against the best. This guide gives you the exact KPIs, industry standards, and performance gaps that separate reactive maintenance cultures from data-driven ones. Ready to close your performance gap today? Start a free 30-day trial or book a demo with the Oxmaint healthcare team.
Hospital Maintenance Benchmarking Guide
KPIs, Industry Standards & How Top Healthcare Systems Outperform
Pinpoint exactly where your maintenance program stands, which metrics matter most, and the operational levers top-performing hospitals pull to stay ahead of failures, costs, and compliance audits.
See Where Your Hospital Stands Against Industry Benchmarks
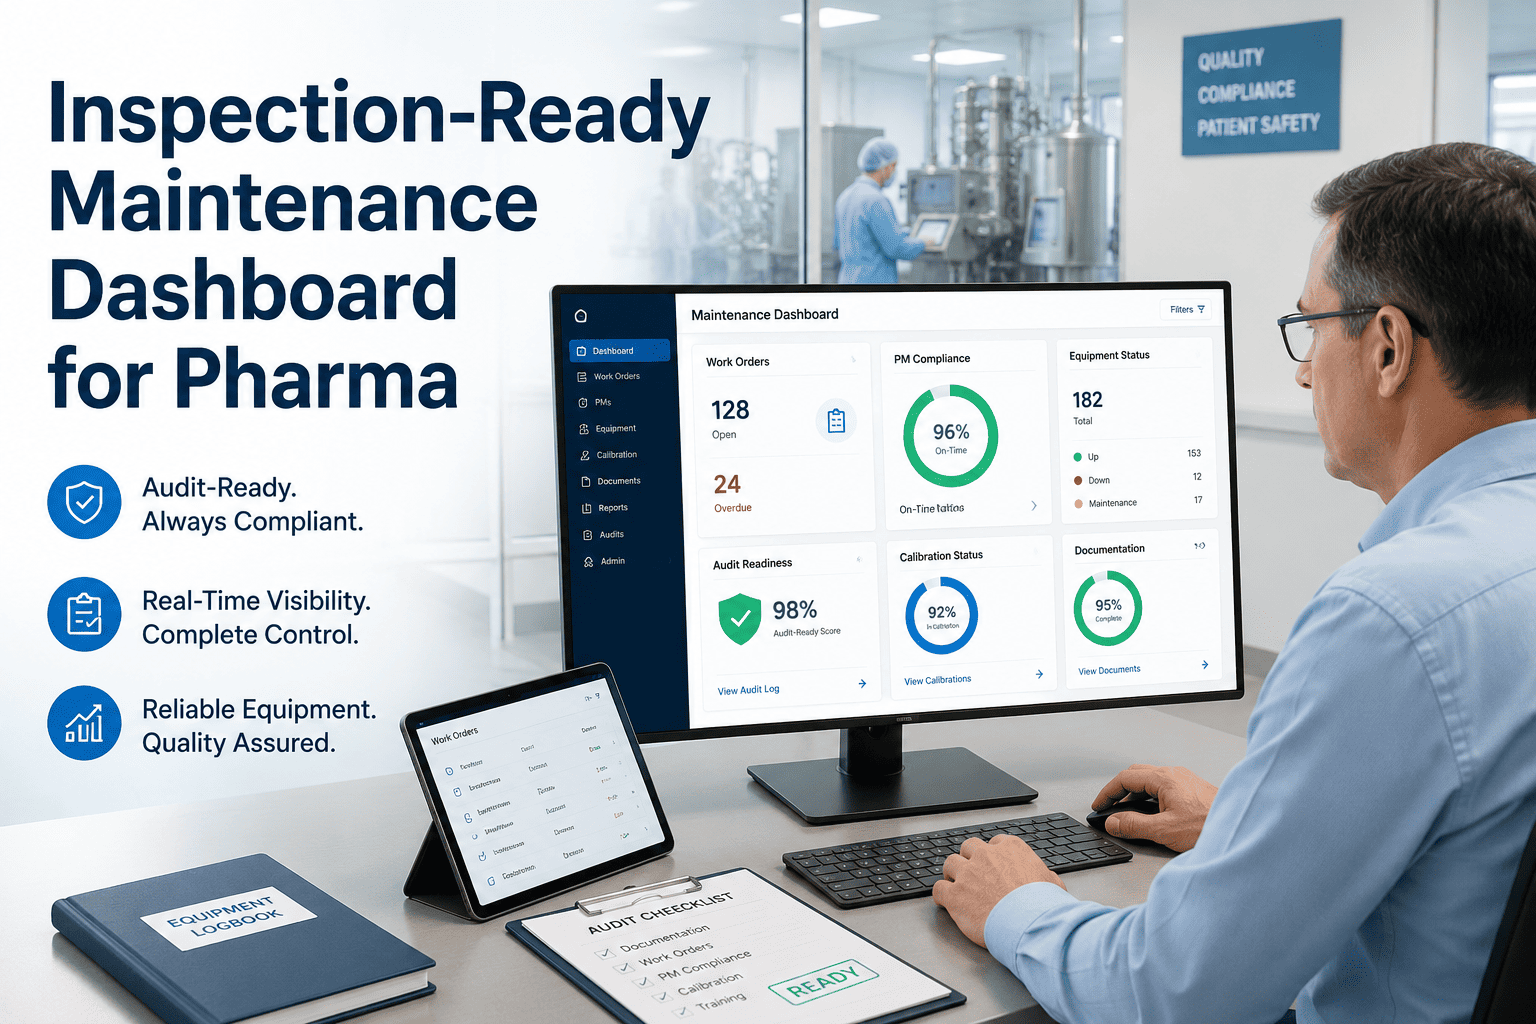
Oxmaint's healthcare CMMS gives maintenance leaders real-time visibility into every KPI covered in this guide — PM compliance, reactive ratios, asset uptime, and CapEx forecasting — across every site in your portfolio. No heavy onboarding. No spreadsheets. Up and running in days.
What Is Hospital Maintenance Benchmarking?
Hospital maintenance benchmarking is the structured process of measuring your facility's maintenance performance against established industry standards, peer institutions, and top-quartile health systems. It turns raw operational data into comparative intelligence — revealing exactly where your program excels and where cost, risk, or reliability gaps are costing you.
Unlike general facility audits, benchmarking is continuous and forward-looking. It ties KPIs directly to patient safety outcomes, regulatory compliance posture, and capital budget decisions. A maintenance director who benchmarks consistently does not wait for failures — they see them coming months in advance and act on data, not instinct. Want to benchmark your own program right now? Start a free trial and connect your asset data, or book a demo to see how Oxmaint surfaces benchmark KPIs automatically.
For healthcare operations directors managing multi-site portfolios, benchmarking is the only scalable way to identify which facilities are underperforming before they generate a compliance incident or budget blowout. Standards from ASHE, IFMA, and The Joint Commission provide the reference framework — your CMMS data provides the measurement.
The 8 Maintenance KPIs Every Hospital Must Track
These are the metrics ASHE, IFMA, and top-quartile health systems use to measure and manage maintenance program performance. Each KPI comes with the benchmark threshold you should be hitting.
4 Benchmarking Failures Costing Hospital Systems Dearly
Most hospitals collect maintenance data. Very few turn it into actionable benchmarks. The gap between those two states is where budget overruns, compliance incidents, and clinical disruptions live.
How Oxmaint Closes the Hospital Maintenance Benchmarking Gap
Oxmaint is built specifically for the multi-site commercial and healthcare environment — giving maintenance leaders live benchmark data, not historical reports generated weeks after the fact. If you are ready to move from spreadsheets to a real benchmarking platform, start your free trial today or book a demo to see live hospital dashboards in action.
Average Hospital vs. Top-Quartile Performer: The Full Benchmark Comparison
This is the operational gap that separates benchmark leaders from the majority of hospital maintenance programs. Every row represents a measurable, closable performance gap.
| KPI / Metric | Average Hospital | Top-Quartile Performer |
|---|---|---|
| PM Compliance Rate | 58 – 65% | 88 – 95% |
| Reactive Work Order Ratio | 38 – 45% | Below 18% |
| Critical Equipment Uptime | 91 – 93% | 97 – 99.5% |
| Mean Time to Repair (Critical) | 8 – 14 hours | Under 4 hours |
| Maintenance Cost / Sq Ft | $13.50 – $17 | $10 – $12.50 |
| Work Order Backlog Rate | 22 – 35% | Under 8% |
| Deferred Maintenance Ratio | 12 – 18% of ARV | Under 4% of ARV |
| Compliance Audit Pass Rate | 71 – 78% | 96 – 100% |
Source: ASHE 2024 Hospital Facility Management Survey, IFMA Healthcare Sector Report, Joint Commission Sentinel Event Data 2025. ARV = Asset Replacement Value.
What Closing the Benchmark Gap Actually Delivers
These are the hard financial and operational outcomes healthcare facilities see when they move from reactive to benchmark-driven maintenance — the numbers CFOs and boards respond to.
Frequently Asked Questions
What PM compliance rate should a hospital be targeting as its first benchmarking goal?
The industry standard starting threshold is 85% PM compliance, with top-quartile performers reaching 88–95%. If you are currently below 65%, the priority is identifying your largest categories of overdue PMs and whether the cause is scheduling failure, technician capacity, or parts availability. Oxmaint's dashboard breaks this down automatically by asset class and department, letting you prioritize the highest-impact improvements first. Rather than chasing a single headline number, focus on moving the most critical systems — life safety, imaging, HVAC — to 95%+ before addressing lower-priority assets. To see how that prioritisation works in practice, start a free 30-day trial or book a demo.
How does reactive vs. preventive maintenance ratio affect hospital maintenance costs?
The cost differential is direct and well-documented. Emergency maintenance on identical equipment tasks costs 4.8 times more than the same work performed on a planned schedule — accounting for overtime labor, emergency parts procurement, expedited vendor fees, and the operational disruption cost of unplanned downtime. A hospital running 40% reactive work versus 15% reactive work is effectively paying a 20–30% premium on a substantial portion of its total maintenance budget. Moving the reactive ratio from 40% to under 20% is typically the fastest path to measurable maintenance cost reduction in any healthcare facility of any size.
Which regulatory frameworks use maintenance KPIs as formal compliance requirements?
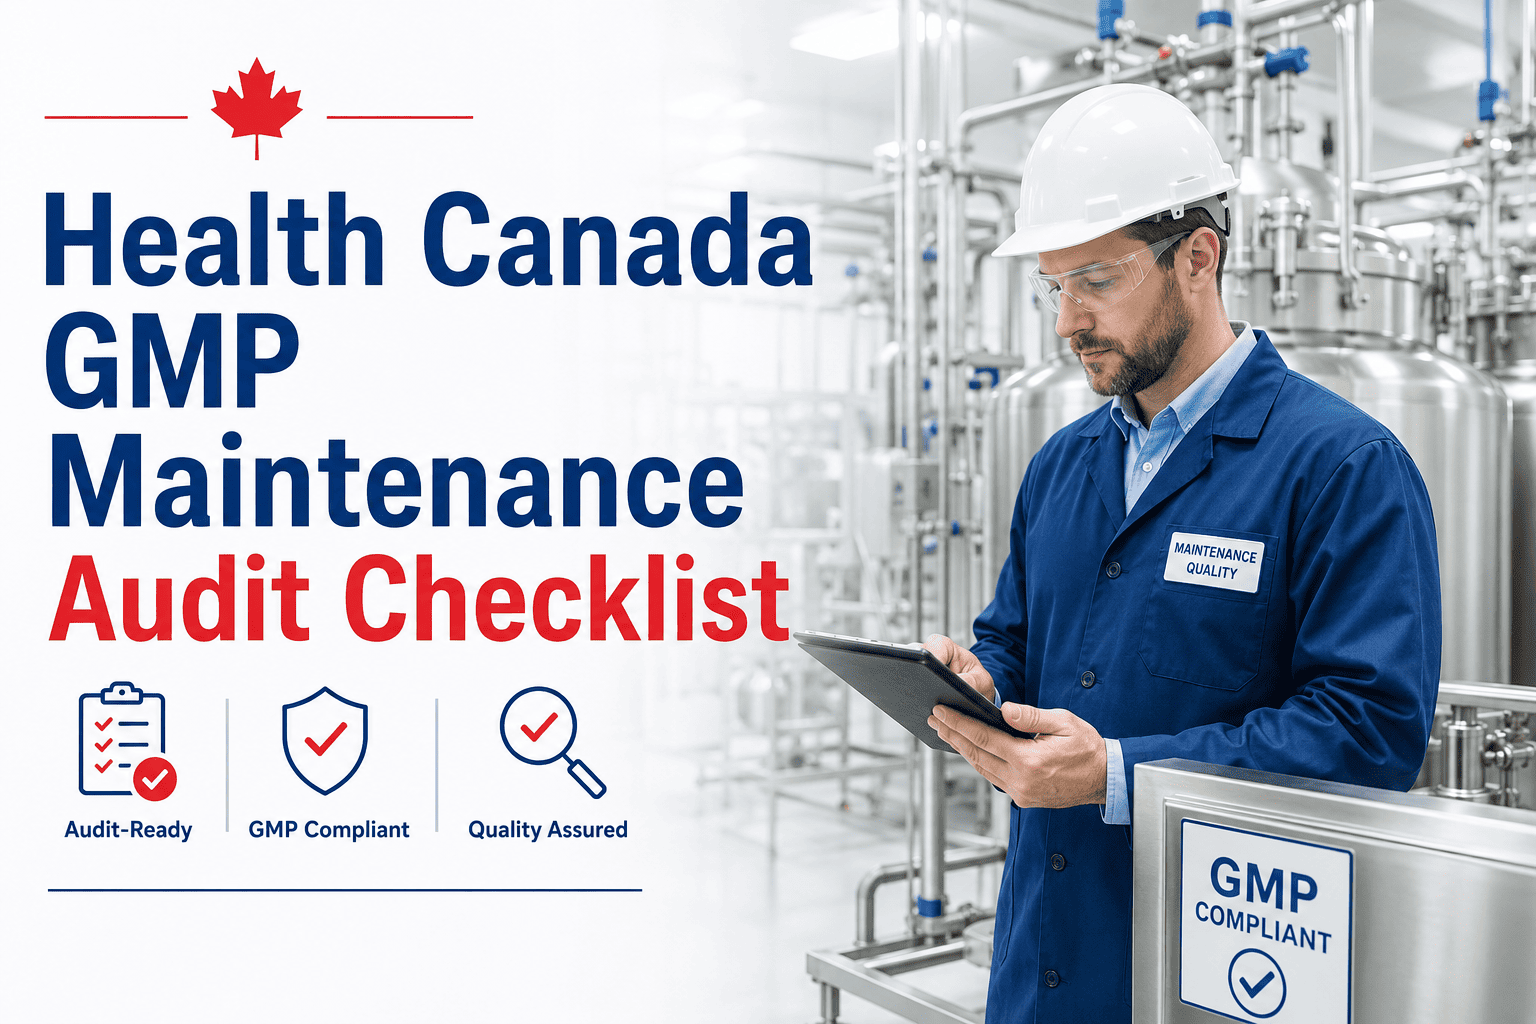
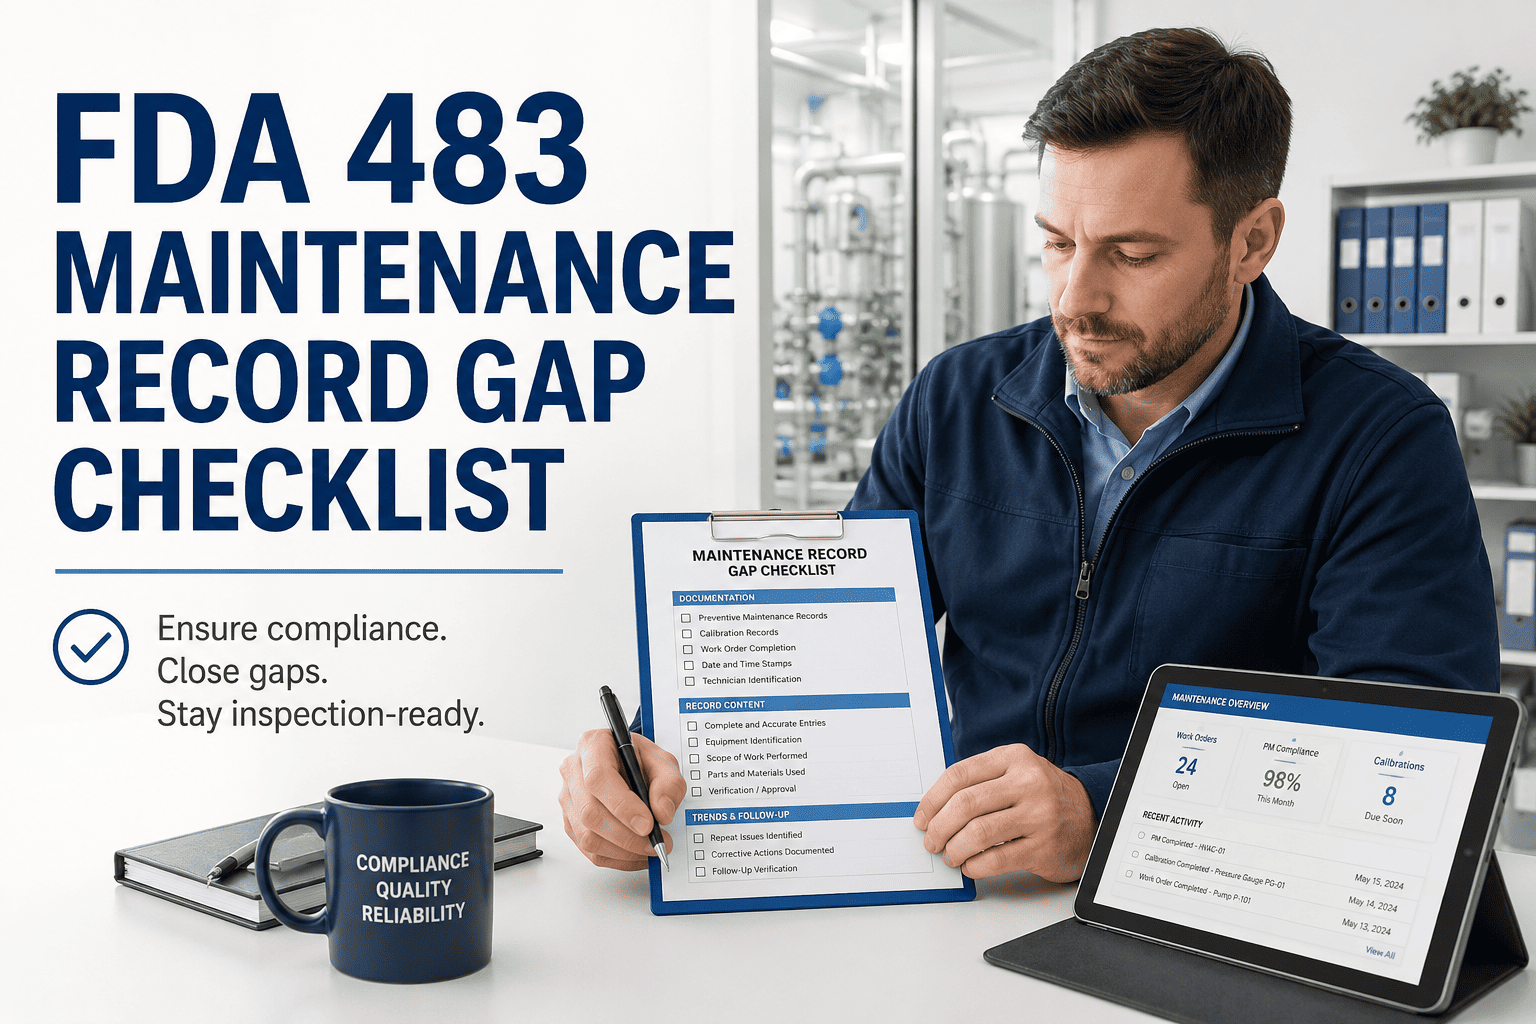
The Joint Commission's Environment of Care (EC) and Life Safety (LS) chapters directly assess PM documentation, equipment testing frequencies, and work order completion records. CMS Conditions of Participation require documented maintenance programs for critical systems including HVAC, medical gas, electrical, and elevators. In the UK, NHS Estates HTM guidance sets specific maintenance frequency standards by equipment category. OSHA 29 CFR 1910 covers preventive maintenance obligations for equipment affecting worker safety. In all these frameworks, the common requirement is not just that maintenance happens — it is that it is documented with timestamps, technician identifiers, and completion evidence that survives an audit review. Spreadsheets and paper records routinely fail this bar.
How does Oxmaint help multi-site hospital networks benchmark across their entire portfolio?
Oxmaint is structured around the asset hierarchy of Portfolio > Property > System > Asset > Component — meaning every KPI is calculable at any level of your organisation in real time. A VP of Operations managing eight hospital campuses can see PM compliance, reactive ratios, backlog rates, and equipment uptime for each site side by side on a single dashboard. Underperforming facilities become immediately visible, not discoverable weeks later in a rolled-up monthly report. Portfolio-level CapEx forecasting aggregates condition scores across all sites into investor-grade replacement schedules that ownership groups and boards can act on confidently. To see portfolio benchmarking in action across a live multi-site environment, start a free trial or book a demo with our healthcare operations team.
Move From Reactive to Benchmark-Driven Healthcare Maintenance
Oxmaint gives healthcare maintenance leaders the live KPI dashboards, condition-based asset tracking, compliance-ready work orders, and rolling CapEx forecasting they need to close every performance gap in this guide — across every site in their portfolio.
Trusted by facility and maintenance managers across the USA, UK, Australia, UAE, and Germany. No heavy implementation fees. No long onboarding. Up and running in days, not months.