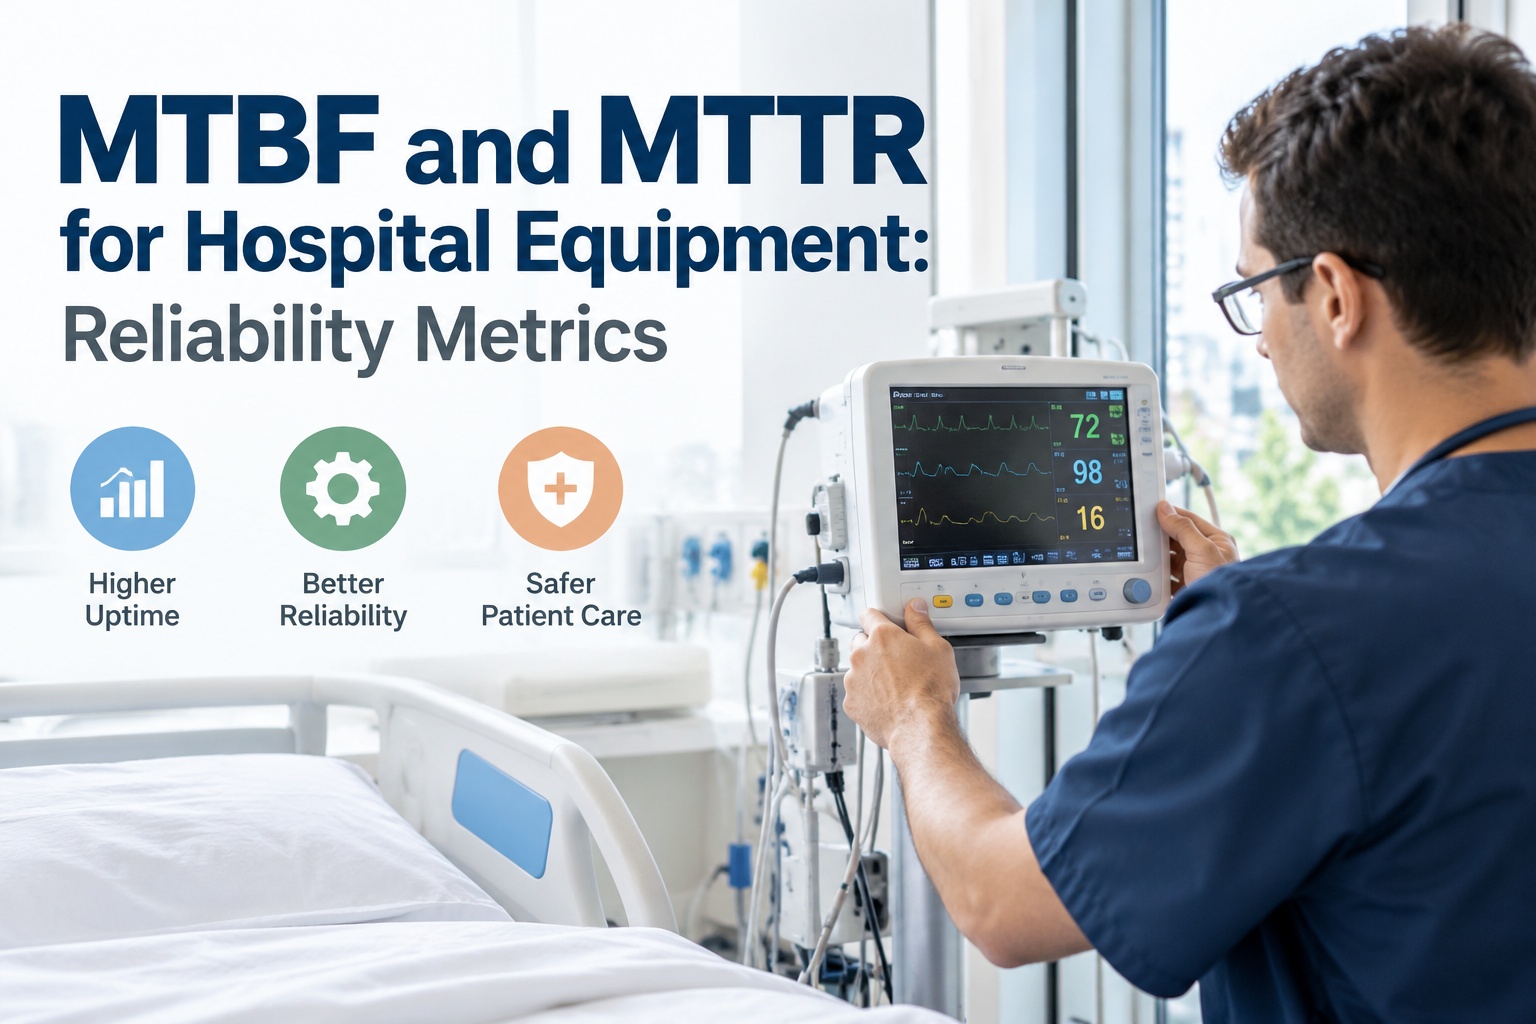
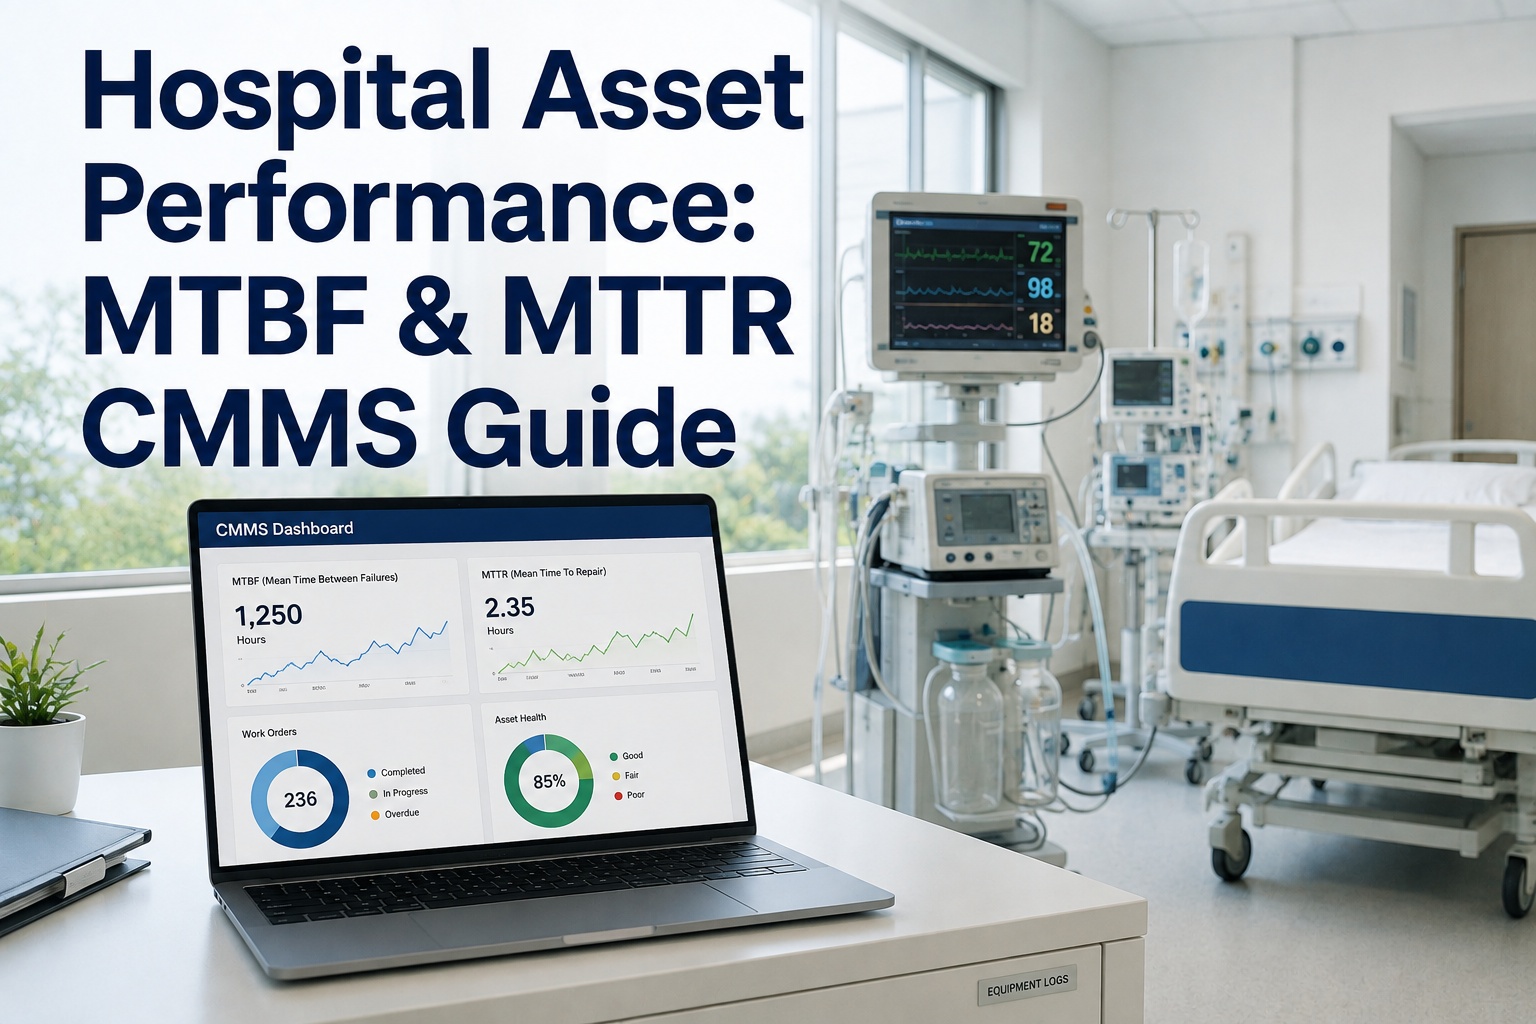
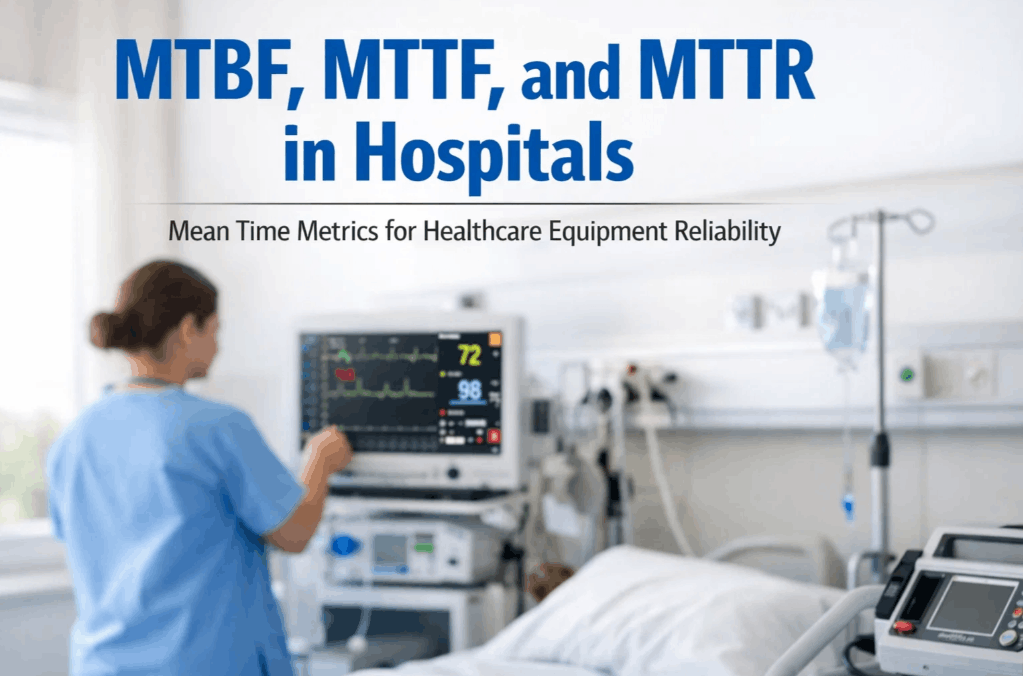
Hospital operations generate an enormous volume of data every day — from equipment sensor readings and work order completions to repair durations and parts expenditure. Yet most healthcare facilities capture only a fraction of this intelligence, leaving maintenance departments to operate on instinct rather than evidence. Medical data analytics transforms raw maintenance records into strategic performance intelligence, giving hospital leaders the visibility to reduce costs, prevent failures, and make capital decisions with confidence. If your facility is ready to move from reactive guesswork to data-driven operational excellence, sign up for OxMaint and see how hospitals are putting maintenance analytics to work today.
Discover how OxMaint's CMMS analytics dashboards turn maintenance data into measurable hospital performance gains.
What Is Medical Data Analytics in a Maintenance Context?
Medical data analytics, as applied to hospital facilities and biomedical engineering, refers to the systematic collection, aggregation, and interpretation of equipment and infrastructure performance data to support operational decisions. Where clinical analytics focuses on patient outcomes and population health, maintenance analytics targets the physical assets that make clinical care possible — imaging systems, HVAC infrastructure, surgical equipment, laboratory analyzers, and the hundreds of devices that must perform reliably every hour of every day.
A modern Computerized Maintenance Management System (CMMS) is the primary engine of maintenance analytics. It captures structured data across the full asset lifecycle: installation date, maintenance history, failure events, repair durations, parts consumed, technician hours, compliance documentation, and real-time sensor telemetry. When this data is surfaced through purpose-built analytics dashboards, it gives hospital leadership something previously unavailable — a clear, quantitative picture of exactly how their physical infrastructure is performing and what it is costing them. Platforms like OxMaint are purpose-built to make this data continuously accessible and actionable.
The transition from paper-based or spreadsheet maintenance logs to a data-driven CMMS analytics platform is not merely a technology upgrade. It is a strategic capability shift that changes how hospitals plan capital expenditure, manage regulatory risk, and allocate scarce maintenance resources.
The Core KPIs That Drive Hospital Maintenance Intelligence
Meaningful maintenance analytics begins with establishing the right key performance indicators. Not every metric carries equal strategic weight. The following KPIs represent the analytical foundation that high-performing hospital maintenance programs track continuously — and the benchmarks that distinguish reactive facilities from proactive ones.
How CMMS Analytics Dashboards Translate Data into Decisions
The value of maintenance data is only realized when it is surfaced in a form that decision-makers can act on. Modern CMMS analytics dashboards are designed to present complex operational data at multiple levels of granularity — from enterprise-wide portfolio views for health system executives to department-level asset performance summaries for biomedical engineering directors and technician-level work queue analytics for individual team members.
At the health system level, analytics dashboards aggregate maintenance performance across all facilities into a unified performance scorecard. Leaders can compare maintenance cost per bed across hospital campuses, identify facilities with deteriorating MTBF trends before they generate crisis-level disruptions, and track capital expenditure obligations tied to aging asset cohorts. This portfolio-level intelligence transforms maintenance from a cost center into a strategically managed asset.
At the department level, maintenance analytics give clinical engineering and facilities management teams precise visibility into the performance of specific asset classes — imaging equipment, life safety systems, laboratory analyzers, OR technology. Department dashboards surface failure frequency by asset model, compare maintenance costs against OEM benchmarks, and flag equipment approaching end-of-useful-life thresholds that should be incorporated into the next capital planning cycle.
At the operational level, analytics dashboards measure technician wrench time, work order backlog trends, first-time fix rates, and parts usage patterns. These metrics allow maintenance supervisors to identify training gaps, optimize team deployment, and build the evidence base for staffing decisions. When wrench time data shows that technicians are spending 40% of their time on administrative tasks, the business case for additional CMMS automation becomes immediately quantifiable.
Predictive Maintenance Analytics: From Historical Reporting to Forward Intelligence
Traditional maintenance analytics is fundamentally retrospective — it tells you what happened, how long it took to fix, and what it cost. Predictive maintenance analytics adds a forward-looking dimension that fundamentally changes the value proposition. By combining historical failure data with real-time sensor telemetry and machine learning models, predictive analytics platforms generate failure probability scores for individual assets weeks before clinical symptoms appear.
The analytical engine behind predictive maintenance ingests multiple data streams simultaneously: vibration signatures from rotating equipment, thermal imaging data from electrical panels, pressure and flow readings from medical gas systems, and cycle count data from sterilization equipment. Statistical anomaly detection identifies deviations from established normal operating profiles, while machine learning classification models assess whether detected anomalies represent early failure signatures or acceptable operational variation.
The output is not simply an alert — it is a prioritized, risk-scored maintenance recommendation that tells the maintenance team which asset to address, what type of intervention is indicated, which parts should be pre-ordered, and what the estimated consequence of deferral would be in terms of failure probability and clinical impact. This is maintenance intelligence, not just maintenance data. To see how this capability is deployed in practice, book a demo with OxMaint and walk through a live predictive analytics workflow.
CapEx Planning Powered by Maintenance Analytics
Capital expenditure planning in healthcare has historically relied on vendor replacement schedules, department requests, and periodic physical assessments — a combination that frequently results in either premature replacement of serviceable equipment or deferred replacement of assets that have quietly become liabilities. Maintenance analytics fundamentally improves this process by providing the objective, longitudinal performance data that transforms CapEx planning from advocacy-based to evidence-based.
| Analytics Input | CapEx Planning Application | Decision Quality Impact |
|---|---|---|
| Maintenance cost per asset trend | Repair vs. replace threshold analysis | Eliminates premature replacements; flags true end-of-life |
| MTBF deterioration curves | Failure risk scoring for budget prioritization | Allocates CapEx to highest-risk assets first |
| Asset availability rate by unit age | Revenue impact modeling for replacement timing | Quantifies financial cost of deferred replacement |
| Parts obsolescence tracking | Vendor lifecycle and parts risk assessment | Surfaces hidden replacement urgency before failure |
| Compliance gap documentation | Regulatory risk-weighted prioritization | Protects accreditation status through proactive investment |
| Energy consumption anomalies | Operational efficiency ROI for new equipment | Supports sustainability and utility cost reduction goals |
When a hospital's finance committee reviews a CapEx request for imaging equipment replacement, the difference between a request supported by three years of MTBF trends, repair cost escalation data, and modeled revenue impact versus a request based on "the equipment is old" is significant. Maintenance analytics provides the quantitative foundation that makes capital requests defensible, reduces approval friction, and ensures that limited CapEx budgets are allocated to genuine priorities rather than the loudest departmental voices. Health systems using OxMaint's analytics platform consistently report stronger CapEx approval rates backed by objective performance data.
Integrating Maintenance Analytics with Clinical and Financial Systems
The full value of maintenance intelligence is realized when CMMS analytics data flows into the broader hospital information ecosystem. Standalone maintenance dashboards are valuable, but bidirectional integration with clinical scheduling, EHR platforms, and financial reporting systems creates a connected operational intelligence layer that supports decisions across the enterprise. A purpose-built platform like OxMaint is designed with these integration pathways as a core architectural feature, not an afterthought.
When CMMS analytics identifies elevated failure risk for HVAC systems in surgical suites or predicts an upcoming autoclave maintenance window, that intelligence should flow automatically into OR scheduling systems. This allows clinical leadership to adjust the surgical calendar proactively — protecting patient safety and preventing the revenue disruption of emergency cancellations.
Maintenance cost data disaggregated by cost center, asset class, and failure type integrates directly into hospital accounting and financial reporting workflows. This allows CFOs to track maintenance as a managed financial variable rather than an opaque operational expense, and it creates the cost-per-procedure visibility that increasingly matters for value-based care contracting.
Compliance documentation completeness, regulatory gap tracking, and failure event records from the CMMS feed directly into enterprise risk management systems. This integration transforms maintenance data into risk intelligence, enabling the hospital's risk management function to quantify and manage equipment-related liability exposure with the same rigor applied to clinical risk.
Equipment energy consumption data captured through IoT sensor integration surfaces anomalies that indicate both maintenance needs and efficiency opportunities. Integration with building energy management systems allows facilities teams to correlate maintenance interventions with energy performance outcomes — a growing priority as hospitals pursue sustainability commitments and operating cost reduction targets simultaneously.
Building a Data-Driven Maintenance Analytics Program: The Implementation Path
Implementing a mature maintenance analytics capability is a phased journey. Hospitals that attempt to deploy full predictive analytics capabilities without first establishing foundational data infrastructure consistently encounter implementation challenges. The following roadmap reflects the sequence that leading health systems have used to build analytics maturity progressively, capturing value at each stage while building toward full intelligence integration.
| Phase | Focus | Analytics Capabilities Unlocked | Timeline |
|---|---|---|---|
| Phase 1 | Data Foundation | Asset inventory, baseline condition records, historical maintenance import | Months 1–3 |
| Phase 2 | CMMS Activation | Work order analytics, PM compliance tracking, technician productivity metrics | Months 2–5 |
| Phase 3 | KPI Dashboard Deployment | MTBF/MTTR trending, cost-per-asset analysis, compliance gap reporting | Months 4–7 |
| Phase 4 | IoT Sensor Integration | Real-time condition monitoring, anomaly detection, alert-driven workflows | Months 5–10 |
| Phase 5 | Predictive Analytics | ML failure prediction, risk scoring, proactive maintenance scheduling | Months 8–15 |
| Phase 6 | Enterprise Integration | CapEx analytics, clinical system linkage, financial and risk reporting | Months 12–18 |
Frequently Asked Questions
Key questions healthcare leaders ask when evaluating medical data analytics for hospital maintenance performance.
Traditional maintenance reporting produces static, backward-looking summaries of what occurred — work orders completed, costs incurred, failures experienced. Medical data analytics is a dynamic, continuous intelligence capability. It combines historical data with real-time sensor streams and predictive models to surface trends, forecast failures, identify cost optimization opportunities, and support strategic capital decisions. The distinction is the difference between a rearview mirror and a navigation system.
MTBF analysis reveals patterns in equipment failure intervals that are invisible at the individual event level. When a CMMS tracks MTBF over time for a specific asset model, it can identify whether failures are clustering at predictable intervals — indicating that preventive maintenance schedules should be adjusted — or whether MTBF is declining progressively, signaling that the asset is entering end-of-useful-life territory. These insights allow maintenance programs to shift from fixed-schedule PM to condition-optimized intervention, extending MTBF and reducing the frequency of clinical disruptions.
A comprehensive hospital CMMS analytics dashboard typically displays asset availability rates, MTBF and MTTR trends by asset class, PM compliance percentages, reactive versus planned maintenance ratios, maintenance cost per asset, technician wrench time and work order backlog metrics, compliance documentation completeness scores, and parts inventory utilization. Advanced platforms also surface failure risk scores derived from predictive analytics models and provide drill-down capability from portfolio-level summaries to individual asset histories.
Maintenance analytics provides the objective performance history that transforms CapEx requests from subjective advocacy into data-driven business cases. By tracking maintenance cost escalation per asset over multi-year periods, modeling the revenue impact of declining asset availability, and surfacing parts obsolescence risks, analytics platforms give finance committees the quantitative evidence needed to allocate capital to genuine priorities. Hospitals using CMMS analytics for CapEx planning consistently report higher approval rates for maintenance-driven capital requests and fewer reactive emergency replacements.
Yes. OxMaint is architected for enterprise health system deployment with multi-facility analytics as a core capability. Health system executives can view portfolio-level maintenance performance comparisons across all campuses from a single dashboard, while facility-level teams manage their specific operational workflows within the same platform. This architecture supports both centralized oversight and decentralized execution — giving leadership the visibility to identify performance outliers and allocate support resources across the enterprise efficiently.
OxMaint's analytics-powered CMMS gives hospital teams the KPI dashboards, predictive intelligence, and compliance documentation they need to optimize performance across every asset and every department.