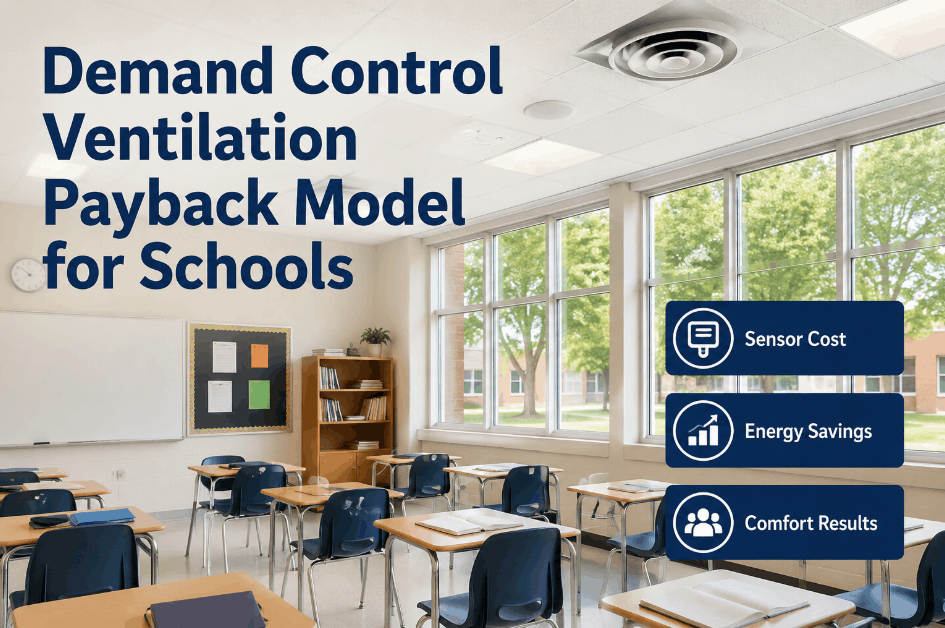
Demand control ventilation delivers measurable energy savings in schools — but only when the payback model accounts for actual sensor cost, realistic occupancy variance, and the full range of comfort outcomes that school administrators require before approving capital expenditure. Sign Up Free on Oxmaint to track DCV system performance data, schedule sensor calibration inspections, and build the ongoing measurement record that validates the payback model your district put forward.
Why DCV Payback Models Fail — And What School Facility Teams Miss
Most DCV payback models presented to school boards use assumptions that degrade quickly in real conditions: fixed occupancy rates, ideal sensor accuracy, and static utility rates. The result is a system that underdelivers projected savings and loses stakeholder confidence. Book a Demo to see how Oxmaint provides the ongoing performance data that keeps DCV payback tracking honest — and enables corrections before variances compound over the school year.
Building a Defensible DCV Payback Model: Four Core Variables
Sign Up Free on Oxmaint to configure CO₂ sensor asset records, occupancy-based ventilation tracking, and seasonal energy data integration that supports a rigorous, auditable school DCV payback model.
CO₂ sensor unit cost, installation labor, and recurring calibration intervals must be included in total system cost. Sensor drift of ±200 ppm degrades ventilation control accuracy — creating a direct link between calibration frequency and payback achievement.
School classrooms rarely operate at design occupancy. Schedule changes, events, and partial days reduce the ventilation modulation opportunity that drives DCV savings. Payback models that use average actual occupancy data instead of design-day assumptions produce more accurate projections.
DCV savings are highest during peak heating and cooling seasons when outdoor air conditioning load is greatest. Payback models must weight savings by seasonal utility rates and actual weather data — not annual averages that flatten the savings profile and understate winter and summer ROI.
School administrators need evidence that DCV delivers acceptable air quality, not just energy savings. Tracking CO₂ levels, temperature comfort complaints, and IAQ audit results alongside energy data creates the dual-outcome validation that secures continued administrative support.
DCV Payback Variables: School Building Context Comparison
Payback outcomes vary significantly across school building types. Book a Demo to see how Oxmaint aggregates DCV performance data across your district's building portfolio to identify which facilities deliver the fastest payback and where system adjustments are needed.
| Building Type | Occupancy Pattern | DCV Savings Potential | Payback Driver | Oxmaint Tracking Action |
|---|---|---|---|---|
| Elementary Classroom Block | Consistent daily schedule, high density | 25–35% ventilation energy | Predictable occupancy cycles | CO₂ trend monitoring per zone |
| High School Gymnasium | Variable, event-driven peaks | 30–40% during off-peak periods | Large unoccupied windows | Occupancy-linked ventilation schedule WO |
| School Cafeteria | Concentrated peak periods, low off-peak | 20–30% overall | Off-peak ventilation reduction | Mealtime occupancy pattern tracking |
| Administrative Offices | Standard business hours, moderate density | 15–25% ventilation energy | Weekend and holiday periods | Scheduled override and setback logging |
| Library / Media Center | Highly variable, low average density | 30–45% ventilation energy | Frequent low-occupancy periods | Real-time CO₂ setpoint compliance tracking |
Implementing a DCV Monitoring Program with Oxmaint
Register CO₂ Sensors and AHU Assets with Design Parameters
Create individual Oxmaint asset records for each CO₂ sensor and air handling unit — including design ventilation rates, CO₂ setpoints, zone assignments, and sensor calibration intervals. Design parameters become the performance baseline against which payback tracking compares actual results.
Connect IoT Sensor Data for Continuous CO₂ and Airflow Monitoring
Oxmaint ingests real-time CO₂ concentration, supply airflow, and damper position data — enabling continuous DCV performance monitoring without manual spot readings. Continuous data surfaces calibration drift, damper faults, and setpoint violations before they degrade payback outcomes.
Schedule Sensor Calibration and Controls Verification Inspections
CO₂ sensor drift directly degrades DCV accuracy and savings delivery. Oxmaint dispatches seasonal calibration work orders with asset-specific checklists — ensuring sensors operate within accuracy tolerances and controls logic matches programmed setpoints throughout the school year.
Track Energy and Comfort KPIs Against Payback Model Assumptions
Oxmaint's analytics dashboard compares actual ventilation energy against payback model projections — flagging variance early so facility managers can investigate whether sensor performance, occupancy changes, or utility rate shifts are responsible and take corrective action.
Report District-Wide DCV Performance to Administration and Procurement
Oxmaint aggregates DCV performance data across every school in the district — enabling portfolio reporting that demonstrates actual payback progress, identifies underperforming sites for investigation, and supports procurement decisions on future DCV expansion.
DCV Performance KPIs for School Facility Managers
Primary payback indicator. Compares actual ventilation-related HVAC energy against pre-DCV baseline to confirm savings delivery matches model assumptions used for capital approval.
Sensor drift is the leading cause of DCV underperformance in schools. Tracking calibration compliance directly links maintenance scheduling to payback achievement — making this KPI as important as energy data.
Measures how often classroom CO₂ levels remain below ASHRAE 62.1 targets during occupied periods. Low compliance signals controls issues or sensor failure — and creates an IAQ liability alongside the energy performance concern.
Confirms DCV controls are responding correctly to occupancy signals. Delayed or absent damper response wastes the energy savings opportunity that justifies the system investment.
Tracks cumulative energy savings against total system cost to calculate remaining payback period. Early variance from model assumptions is flagged so facility teams can investigate root causes before the payback timeline extends significantly.
DCV must deliver energy savings without degrading comfort. Tracking comfort complaints in DCV-controlled zones confirms the system is not compromising air quality to chase savings — a critical metric for maintaining school administration support.