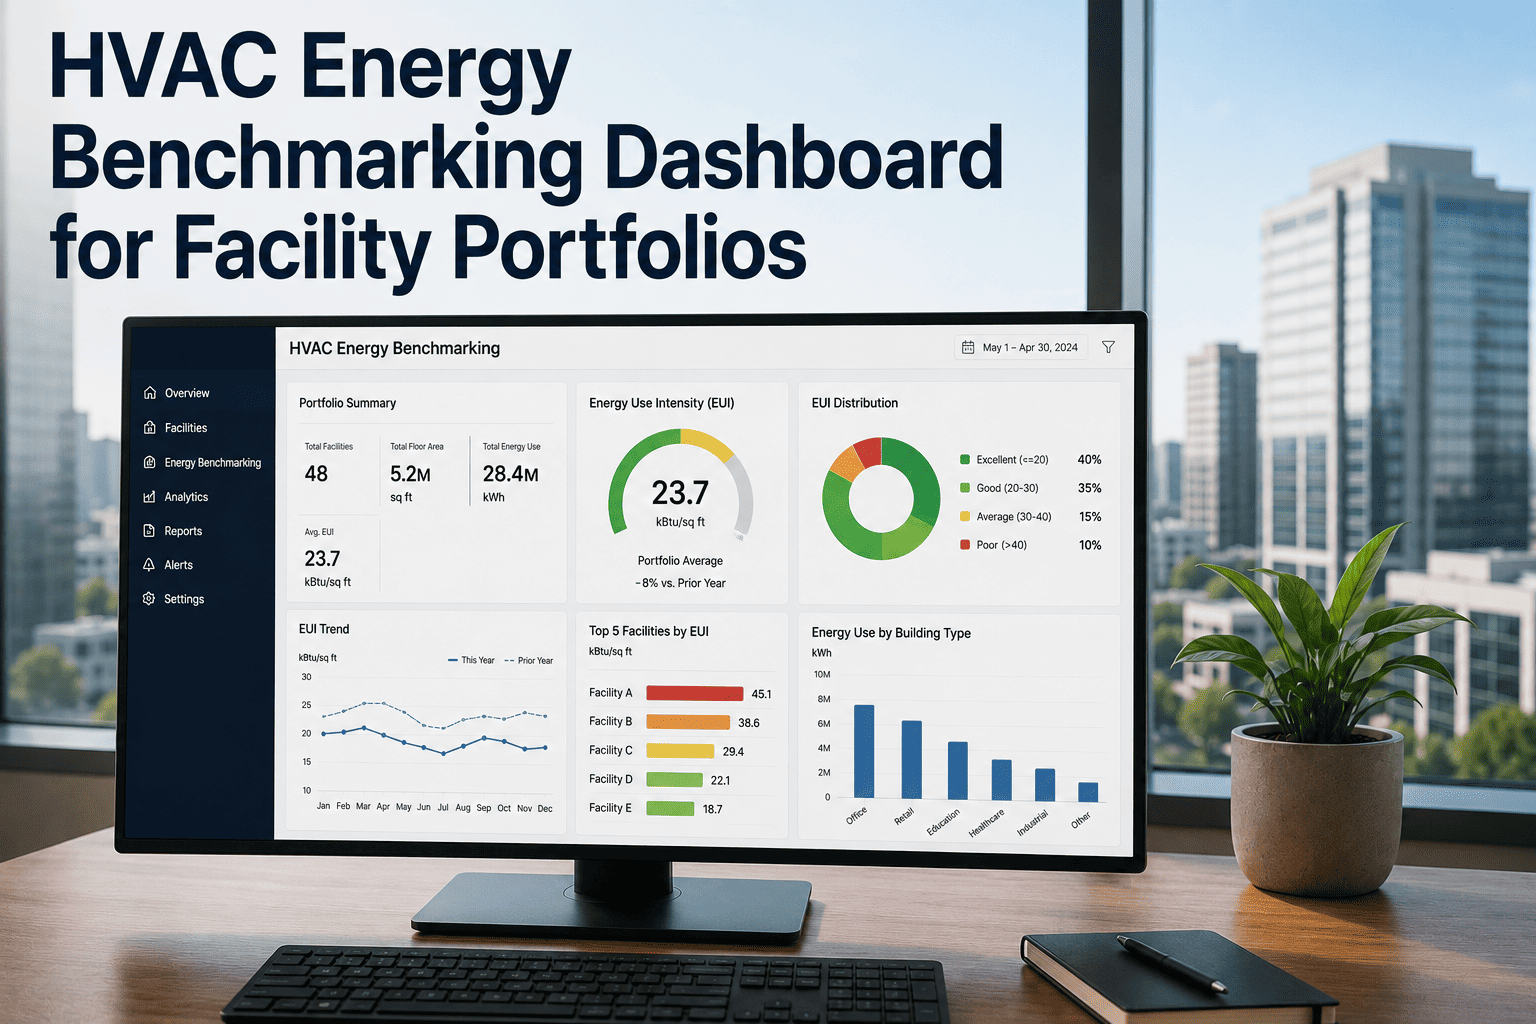
Twelve buildings, twelve utility bills, and no honest way to say which one is wasting energy. A big site will always burn more kilowatt-hours than a small one — that doesn't make it inefficient. Benchmarking fixes the comparison by normalizing energy to floor area and performance, so a 200,000-sq-ft office and a 40,000-sq-ft branch land on the same scale and the real underperformers stop hiding behind their size. And because HVAC is the single largest energy end-use in most commercial buildings, the worst benchmark scores almost always trace back to it — often to a maintenance issue a work order would have caught. OxMaint AI maintenance management software connects the two: the benchmark tells you which building is off, and the asset history tells you why.
Rank Every Building on the Same Scale — and Fix What the Benchmark Exposes
Across a portfolio, raw energy bills lie: the biggest building looks like the worst, and the real waste stays buried. Normalized benchmarking — EUI, kW/ton, ENERGY STAR score — puts every site on one honest ranking, and since HVAC drives roughly a third of the energy, the outliers point straight at equipment. OxMaint AI turns that signal into action: when a benchmark flags a building, its asset history shows the clogged filter, leaking duct, or drifting chiller behind the number.
The Three Metrics That Make Buildings Comparable
Benchmarking works because it strips out size and reports performance instead. These are the three metrics a portfolio ranking runs on. Start free and track them per building in OxMaint AI.
EUI Benchmarks by Building Type
A number only means something against a peer. These are typical commercial EUI ranges and the share HVAC drives in each — the reference your portfolio ranks against. Book a demo to see your buildings against these ranges in OxMaint AI.
| Building type | Typical EUI (kBtu/sq ft/yr) | HVAC share |
|---|---|---|
| Office | 52–65 | ~33% |
| Retail / mall | 75–90 | ~35% |
| K–12 schools | 48–68 | ~38% |
| Healthcare / hospital | 100–250 | ~44% |
| Warehouse / storage | 10–30 | ~20% |
| Restaurant / food service | 200–350 | ~30% |
Normalize First — or the Ranking Lies
Raw kWh punishes big buildings and hides efficient small ones. Fair benchmarking adjusts for the factors that aren't a building's fault before it ranks anything. Sign up free and benchmark on normalized figures in OxMaint AI.
A Bad Benchmark Is a Symptom. The Cause Is Usually an Asset.
Ranking a building last tells you where to look — it doesn't fix anything. The energy is almost always leaking through HVAC equipment that maintenance would catch. OxMaint AI links the benchmark to the asset, so a poor score becomes a specific work order, not a mystery.
Where the Wasted Energy Actually Hides
When a building benchmarks poorly, the cause is rarely exotic — it's a maintenance defect quietly adding kBtu per square foot. Each of these is a work order waiting to happen. Book a demo to see maintenance-to-energy links in OxMaint AI.
How OxMaint AI Closes the Benchmark Loop
A benchmark that only ranks is a report. A benchmark tied to your assets is a fix list. OxMaint AI connects the score to the equipment behind it. Start free and turn energy signals into work orders.
Frequently Asked Questions
Rank the Portfolio. Then Fix What the Ranking Reveals.
A normalized benchmark is the only fair way to compare buildings — but a ranking alone never saved a kilowatt. The energy is lost inside HVAC equipment, and the fix is a work order against a specific asset. OxMaint AI joins the two: the benchmark points to the building, the asset history names the cause, and the trend proves the repair worked — so energy performance becomes something you manage, not just report.