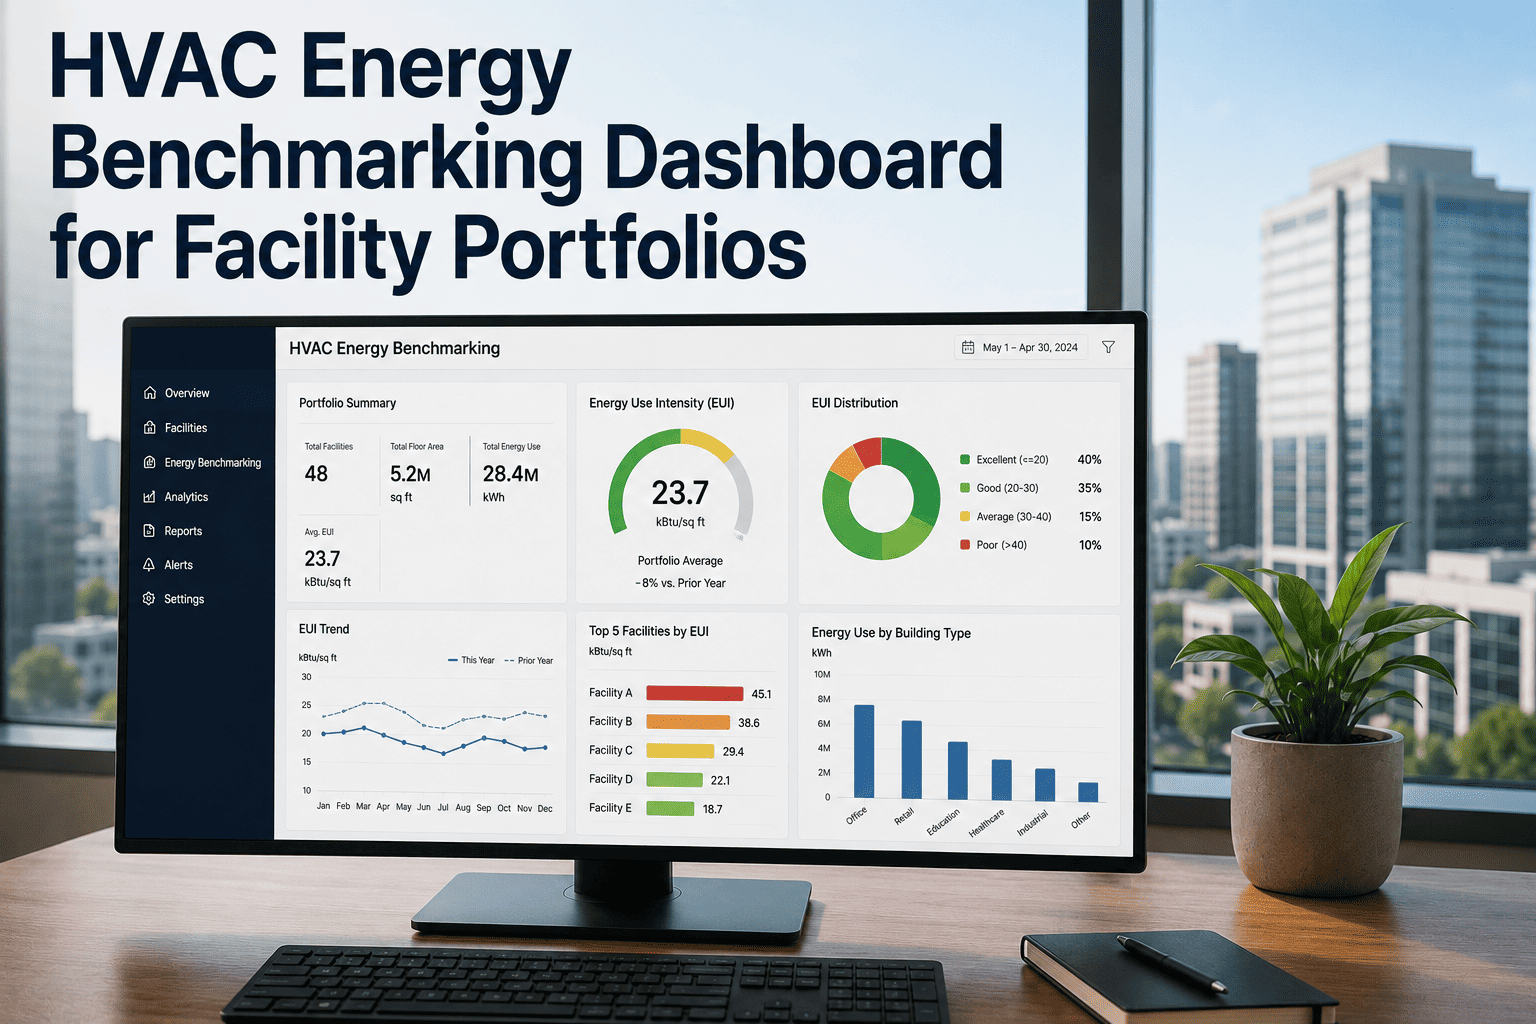
HVAC energy savings are an absence — you can't meter the kilowatt-hours you didn't use, so every credible savings claim is a comparison against what the system would have consumed without the project. This guide walks the IPMVP Options A–D, the 12-month baseline minimum, weather normalization, and ASHRAE Guideline 14 acceptance thresholds that turn a claimed saving into a defensible one. Start free on OxMaint to load the M&V template, or book a demo.
HVAC Energy Benchmarking & M&V · Where Savings Claims Stand Up to Finance
IPMVP Options · baseline modeling · weather normalization · ASHRAE Guideline 14.
4
IPMVP Options — A, B, C, D. Choosing correctly is the single most important M&V decision on a project
12 mo
Minimum baseline period to capture full seasonality — reconstructed baselines fail finance and third-party review
≤ 15%
ASHRAE Guideline 14 CV(RMSE) acceptance target on monthly whole-facility baseline models
35→65
ENERGY STAR Portfolio Manager percentile move — the external-benchmarking narrative boards and investors actually understand
The IPMVP 4 Options · Decision Matrix for HVAC Projects
IPMVP defines four Options for determining savings, and the choice among them is where every M&V engagement starts. The right pick depends on where the measurement boundary sits (single ECM versus whole building), what data is available, and how much rigor the savings claim needs to carry. The decision matrix below is the field-standard shortcut.
| Option | Measurement Boundary | When to Use | Rigor & Cost | HVAC Example |
|---|
| Option A Retrofit Isolation · Key Parameter |
Around the ECM only |
Simple, isolated ECM with a few key parameters; other parameters stipulated from engineering data |
Lowest cost · lowest rigor |
HVAC unit replacement where kW is measured and runtime hours are stipulated |
| Option B Retrofit Isolation · All Parameter |
Around the ECM only |
ECM where all parameters affecting savings are measured continuously post-install |
Moderate cost · higher rigor |
VFD retrofit on a chilled-water pump — both kW and runtime metered continuously |
| Option C Whole Facility |
Whole building or main meter |
Whole-building programs, multiple interacting ECMs, or when interactive effects matter |
Moderate cost · strong for large programs |
Building-wide HVAC retrofit measured against weather-normalized utility bills |
| Option D Calibrated Simulation |
Whole building or sub-system |
New construction, major renovation, missing baseline data, complex interactive systems |
Highest cost · appropriate where measurement isn't practical |
New HVAC on new construction — simulation model calibrated against post-install actual data |
Rule of thumb
If a single ECM's performance is the question, favor Option A or B. If the whole facility's energy is the question, favor Option C. If baseline data doesn't exist (new construction, missing history), Option D is often the only defensible choice. Never let convenience drive the option — a cheap Option A on a project that needs Option C is what auditors flag.
The Six-Step M&V Lifecycle · From Plan to Reported Savings
Every credible M&V engagement runs the same six-step lifecycle. The single most common failure pattern in energy projects is starting without an M&V plan and reconstructing the baseline months after the retrofit — that reconstruction almost never survives finance or a third-party CMVP review. Do the steps in order, do them once.
Step 01
M&V Plan
Written before the ECM is installed. Names the IPMVP Option, defines the measurement boundary, lists independent variables (weather, occupancy, production), sets the reporting frequency and acceptance thresholds.
Step 02
Baseline Period
Minimum 12 months of representative pre-retrofit operation to capture full seasonality. Utility bills, submeter data, weather data, occupancy data collected and cleaned.
Step 03
Implementation
ECM installed. Metering and sensors commissioned per the plan. Any changes to the plan documented and re-approved before proceeding.
Step 04
Performance Period
Post-install monitoring runs for the reporting period defined in the plan (typically a minimum of 12 months for whole-facility Option C to match baseline seasonality).
Step 05
Adjustments
Routine adjustments (weather, occupancy, production) applied through regression. Non-routine adjustments logged and quantified for any change unrelated to the ECM.
Step 06
Report Savings + Uncertainty
Savings = Adjusted-Baseline Energy − Reporting-Period Energy. Reported with confidence interval, CV(RMSE), NMBE, and full documentation of adjustments made.
Baseline & Weather Normalization · The Regression Every Building Needs
Weather is the single largest independent variable affecting HVAC energy — heating load rises with heating degree days (HDD), cooling load rises with cooling degree days (CDD), and any raw before-versus-after comparison that ignores weather is not M&V, it's a spreadsheet. The regression below is the ASHRAE Guideline 14 field-standard approach for a monthly whole-facility model.
Input
Monthly Utility Data + Weather
12 months of monthly billing kWh / therms, matched to monthly HDD and CDD from the nearest weather station (NOAA, weather service).
→
Model
Change-Point or Linear Regression
Energy = α + β·HDD + γ·CDD (linear) — or 3-parameter / 5-parameter change-point models when consumption has clear balance-point behavior.
→
Validate
CV(RMSE) & R² Check
Guideline 14 target: monthly CV(RMSE) ≤ 15%, NMBE ≤ ±5%, R² typically > 0.75. Miss these and revisit the model or the data quality.
→
Apply
Adjust Baseline to Reporting Weather
Feed reporting-period HDD/CDD into the baseline model to compute the counterfactual "what the building would have used" — the number you subtract from actual to get savings.
Common M&V Failures · Why Energy Projects Lose Credibility With Finance
Modest projects with disciplined M&V sail through third-party review; strong projects with weak M&V get their savings cut in half by an auditor's red pen. The five failures below are the ones that come up most often and the ones that are entirely avoidable at plan time.
Failure 01
No M&V Plan Before Retrofit
Baseline gets reconstructed months after the ECM is live. Data gaps, documentation gaps, and no defensible boundary. The most common cause of failed CMVP review.
Failure 02
Raw-Bill Before/After Comparison
A mild winter after the retrofit "proves" 30% savings; a cold winter after the retrofit "proves" savings evaporated. No weather normalization = no M&V.
Failure 03
Non-Routine Events Ignored
Occupancy doubles, production shifts change, another ECM lands in the middle of the reporting period — and the model still says the original retrofit is doing all the work.
Failure 04
No Uncertainty Statement
A savings claim of "12.34%" with no confidence interval reads as false precision. Real M&V reports as a range with CV(RMSE), NMBE, and confidence bounds.
Failure 05
Manual Spreadsheet Data Handling
Discontinuous data, version chaos, transcription errors. Automated continuous data capture and audit-ready reporting is the field standard from 2020 onward.
Failure 06
Wrong IPMVP Option for the Question
A single-ECM Option A used where interactive effects across a whole-building program dominate. Option choice drives everything downstream — pick deliberately, at plan time.
Load the IPMVP-Aligned M&V Template in OxMaint — Free Forever
Sign up on OxMaint's free forever plan and configure your baseline period, submetering points, weather-normalization regression, and post-project reporting per the chosen IPMVP Option. Continuous data capture, automated adjustments, and an audit-ready savings report per building. No card, no time limit.
Reporting Standards · The Statistics Auditors Actually Check
Every credible M&V report carries the same set of statistics. They're not decorative — they're what a CMVP or an IPMVP-literate finance reviewer opens first. Below are the four numbers, what each one tells you, and the ASHRAE Guideline 14 acceptance thresholds.
CV(RMSE)
Coefficient of Variation of Root Mean Square Error
Guideline 14 target: ≤ 15% monthly · ≤ 30% hourly
Measures how well the baseline model predicts observed baseline energy relative to the mean. High CV(RMSE) means the model doesn't explain enough — revisit inputs.
NMBE
Normalized Mean Bias Error
Guideline 14 target: within ±5% monthly · within ±10% hourly
Measures systematic under- or over-prediction bias. High NMBE means the model consistently misses in one direction — usually indicates a missing independent variable.
R²
Coefficient of Determination
Typical acceptance: R² > 0.75 for monthly regression
How much of the baseline energy variance the model explains. Below 0.75 usually means weather normalization alone isn't capturing the drivers — occupancy or production matters too.
Confidence Interval on Savings
Uncertainty range around the reported savings
Report at 68% (1 sigma) or 95% (2 sigma) — matched to project stakes
"12.4% ± 2.1% at 95% confidence" is bankable. "12.34%" alone reads as false precision — the finance and audit test.
External Benchmarking · The Percentile Story Boards Actually Understand
IPMVP and ASHRAE Guideline 14 produce the technical savings number. ENERGY STAR Portfolio Manager produces the narrative — a national percentile ranking that translates efficiency progress into a form non-technical stakeholders instantly get. The two complement each other: internal M&V proves the savings; external benchmarking validates the standing.
Internal
IPMVP + Guideline 14 Savings
The technical number — kWh saved, dollars avoided, % reduction — with CV(RMSE), NMBE, and confidence interval. What CMVP review and third-party auditors scrutinize.
External
ENERGY STAR Portfolio Manager Percentile
National percentile ranking against comparable buildings — a 35th-to-65th-percentile move reads as meaningful progress to a board or investor regardless of absolute kWh.
Combined
CMVP Certification for High-Stakes Claims
For performance contracts, incentive filings, or investor communications — an independent Certified Measurement & Verification Professional signs the report.
How OxMaint Runs the Full HVAC M&V Program
The IPMVP Option choice, the baseline collection, the weather-normalization regression, the non-routine adjustment log, and the confidence-interval-reporting all run on one platform — submeter data ingested continuously, degree-day data pulled automatically, adjustments captured in the audit trail, and savings reports generated on the reporting cadence defined in the plan.
Plan
M&V Plan Templated to IPMVP
Plan template requires IPMVP Option selection, measurement boundary, independent variables, reporting frequency, and acceptance thresholds before the retrofit starts.
Collect
Continuous Baseline & Post Data
Submeter data, utility data, weather data (NOAA HDD/CDD), occupancy data captured continuously and versioned. No spreadsheet round-trip.
Model
Regression & Change-Point Baselines
Linear, 3-parameter, or 5-parameter change-point regressions per asset or facility, with CV(RMSE), NMBE, and R² computed automatically.
Adjust
Routine + Non-Routine Log
Weather / occupancy / production normalizations applied automatically. Non-routine events logged with quantified impact and rolled into the report.
Report
Savings + Confidence Interval
Every reporting period produces a Guideline 14-compliant report — savings, CV(RMSE), NMBE, R², confidence interval, and adjustment audit trail.
Benchmark
ENERGY STAR Portfolio Sync
Facility energy data syncable to ENERGY STAR Portfolio Manager for national percentile ranking — the external narrative alongside the internal number.
Turn Every HVAC Efficiency Project Into a Defensible Savings Claim
Free forever plan — no card, no time limit. Load the M&V plan template, wire the baseline collection to your submetering, and every reporting period produces a Guideline 14-compliant savings report with confidence intervals and audit trail. Or book 30 minutes and we'll walk your active efficiency project end-to-end on the platform.
Frequently Asked Questions
What are the four IPMVP Options and how do you pick the right one?
Option A — Retrofit Isolation with Key Parameter Measurement — measures a few key parameters at the ECM and stipulates others. Option B — Retrofit Isolation with All Parameter Measurement — measures every relevant parameter continuously at the ECM. Option C — Whole Facility — measures the whole building or main meter, typically via weather-normalized utility bills. Option D — Calibrated Simulation — uses a calibrated energy model, appropriate for new construction or where measured baseline data doesn't exist. Pick A or B for isolated ECMs, C for whole-facility programs with interactive effects, D when direct measurement isn't practical.
Why can't you just compare utility bills before and after the retrofit?
Because a mild winter after the retrofit would show you saved thirty percent, and a cold winter after the retrofit would show your savings disappeared. Weather is the single largest independent variable affecting HVAC energy, and a raw before-and-after comparison that doesn't normalize for heating and cooling degree days isn't measurement and verification — it's a coincidence report. Every credible M&V engagement builds a regression model of baseline energy against HDD and CDD, then feeds the reporting-period weather into that model to compute what the building would have used absent the ECM. The savings are the difference between that counterfactual and the actual reporting-period consumption.
How long does the baseline period need to be?
Minimum twelve months of representative pre-retrofit operation, to capture a full year of seasonality across heating and cooling load. Reconstructed baselines assembled after the ECM is live almost always fail finance and third-party CMVP review — the data gaps, documentation gaps, and lack of a defensible boundary are the most common cause of a rejected savings claim. The M&V plan must be written before the retrofit starts, and baseline data collection must be part of the project scope from day one.
What ASHRAE Guideline 14 statistics should appear on the M&V report?
Four numbers matter most. CV(RMSE) — coefficient of variation of root mean square error — with a monthly target of no more than 15% and hourly target of no more than 30%. NMBE — normalized mean bias error — with a monthly target within ±5% and hourly within ±10%. R² — coefficient of determination — typically greater than 0.75 for a monthly regression. And a confidence interval on the reported savings, typically at 95% (two sigma), matched to the stakes of the claim. A savings number without these statistics reads as false precision to any IPMVP-literate reviewer.
Book a demo to see the report shape in OxMaint.
How does ENERGY STAR Portfolio Manager fit alongside IPMVP-based M&V?
They complement each other. IPMVP and ASHRAE Guideline 14 produce the technical savings number — the kWh saved, the dollars avoided, the confidence bounds. ENERGY STAR Portfolio Manager produces the external narrative — a national percentile ranking against comparable buildings that translates the technical result into a form boards, investors, and non-technical stakeholders instantly understand. A building that moves from the 35th to the 65th percentile is documented, comparable progress. For high-stakes claims — performance contracts, incentive filings, investor communications — a Certified M&V Professional review signs the internal report and both artifacts get referenced together.
Sign up free to configure both flows on your first shift.