HVAC energy benchmarking reveals why two similar-sized buildings can have utility bills that differ by 40% or more — building type, occupancy density, and climate zone each drive load profiles in ways that generic energy targets completely miss. Facility managers using Sign Up Free with Oxmaint gain a structured view of HVAC energy intensity across their entire portfolio, normalized for weather and occupancy, so performance gaps become visible and actionable. Whether you manage office towers, hospitals, schools, or industrial facilities, benchmarking against the right peer group — not a national average — is the difference between meaningful optimization and wasted effort. Oxmaint's analytics and reporting module connects runtime data, utility consumption, and asset health in one place, giving operations teams the foundation for climate-smart, cost-reducing HVAC management. Book a Demo to see how portfolio-level benchmarking works in practice.
HVAC · ENERGY BENCHMARKING · CLIMATE ZONE · BUILDING TYPE · 2026
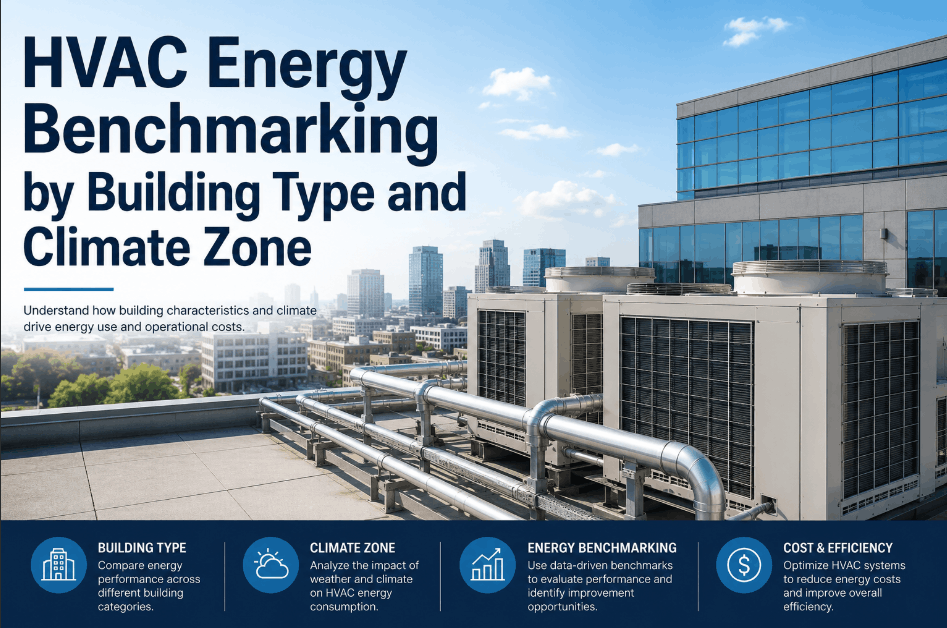
HVAC Energy Benchmarking by Building Type and Climate Zone
Identify where weather, occupancy, and system design are driving HVAC utility costs above peer benchmarks — and close the gap with data-driven maintenance and operations decisions.
40%Energy cost variance between similar buildings without proper climate-zone normalization
15–25%Typical HVAC energy reduction after benchmarking reveals underperforming systems
EUIEnergy Use Intensity — the primary metric for cross-building HVAC performance comparison
5 ZonesASHRAE climate zones that define design load requirements and benchmarking peer groups
Why Generic HVAC Benchmarks Mislead Facility Teams
A hospital in Phoenix and a hospital in Minneapolis serve the same function but face completely different cooling and heating loads. Benchmarking both against a single national average produces misleading results — one building looks over-performing while the other appears efficient when neither conclusion is accurate. Climate zone normalization, building-type load profiles, and occupancy-adjusted intensity metrics are the three pillars of meaningful HVAC benchmarking. Sign Up Free with Oxmaint to start tracking HVAC performance with the context that makes comparisons actionable.
Climate Zone Normalization
Adjust raw consumption by heating and cooling degree days so buildings in different climates are compared on equal footing — not penalized for geography.
Building Type Load Profiles
Hospitals, data centers, schools, and offices have fundamentally different internal load densities. Peer benchmarking must separate these categories to be meaningful.
Occupancy-Adjusted EUI
Energy Use Intensity divided by occupancy hours gives a per-use intensity that corrects for buildings operating at partial occupancy or extended schedules.
System Age Weighting
Equipment installed in different decades has different design efficiencies. Age-weighted benchmarks set realistic targets that separate poor maintenance from aging equipment.
Portfolio Ranking
Ranking all facilities in a portfolio by normalized EUI instantly identifies the top performers to learn from and the underperformers to prioritize for audit and improvement.
Trend Over Time
Year-over-year EUI trend shows whether maintenance investments, equipment upgrades, and operational changes are actually moving the needle on energy performance.
HVAC Energy Intensity by Building Type — Reference Benchmarks
The table below shows median HVAC EUI ranges by building type based on widely referenced commercial building energy studies. These ranges provide the starting reference for peer benchmarking — Oxmaint's analytics module lets you overlay your actual building data against these targets, adjusted for your specific climate zone. Book a Demo to see how Oxmaint maps your portfolio against peer benchmarks.
| Building Type |
Median HVAC EUI (kBtu/sf/yr) |
High-Performance Target |
Primary Load Driver |
Climate Zone Sensitivity |
| Office (Class A) | 35 – 55 | < 30 | Plug loads, lighting waste heat | Medium |
| Hospital / Healthcare | 90 – 140 | < 80 | 24/7 ventilation, sterilization | High |
| K–12 School | 25 – 45 | < 22 | Occupancy density, schedule | High |
| Retail / Big Box | 40 – 70 | < 35 | Door infiltration, lighting heat | High |
| Higher Education | 50 – 80 | < 45 | Lab exhaust, mixed schedules | Medium |
| Hotel / Hospitality | 60 – 95 | < 55 | Domestic hot water, room density | Medium |
| Warehouse / Industrial | 15 – 35 | < 12 | Envelope, dock door infiltration | Very High |
| Data Center (support) | 120 – 200+ | < 100 | Server waste heat, redundancy | Low |
The 5 Variables That Explain Most HVAC Benchmark Variance
1
Envelope Performance
Wall insulation, window U-values, and air leakage rates set the baseline load the HVAC system must overcome. Poor envelope performance in cold or hot climates creates a structural energy penalty no operational change can fully correct.
2
System Design Efficiency
Variable frequency drives, economizer controls, demand-controlled ventilation, and chiller staging logic all determine how efficiently a system meets load. Older constant-volume systems consume 20–35% more energy than modern variable-flow designs at equivalent loads.
3
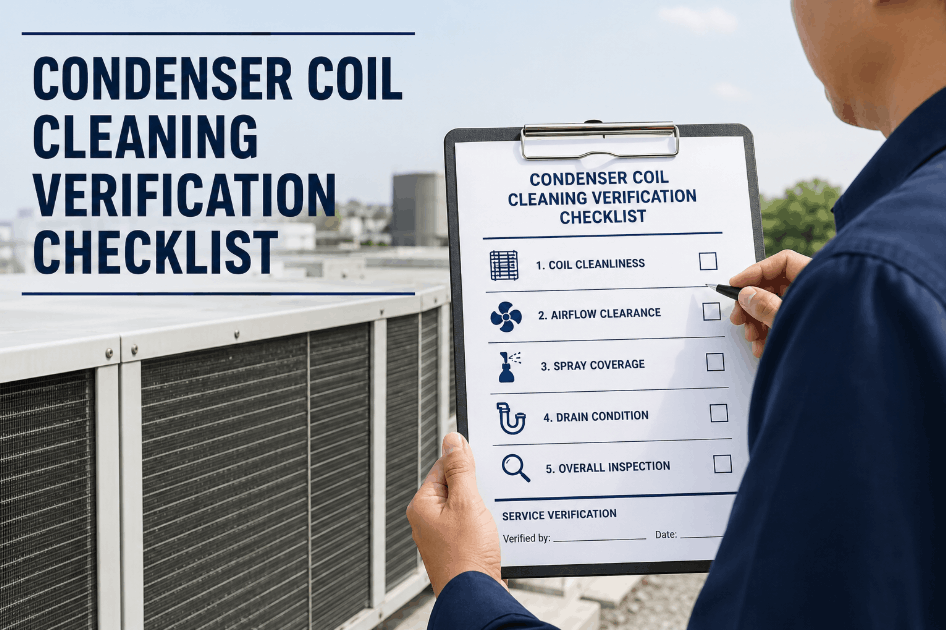
Maintenance State
Dirty coils, clogged filters, refrigerant undercharge, and misaligned economizers create operational inefficiency that often accounts for 10–20% of total HVAC energy consumption above benchmark. Oxmaint's preventive maintenance scheduling directly addresses this gap.
4
Occupancy Scheduling
Buildings conditioning space at full design capacity during low-occupancy periods waste significant energy. Schedule-based setback, occupancy sensing, and demand-controlled ventilation can cut HVAC runtime by 15–30% in variable-occupancy buildings.
5
Climate Zone Severity
ASHRAE climate zones 1–8 define design conditions from humid tropical to subarctic. A building in Zone 7 will carry 3–5x the heating load of an equivalent Zone 2 building. Benchmarking without zone adjustment makes cold-climate buildings look inefficient regardless of operational quality.
How Oxmaint Supports HVAC Energy Benchmarking Programs
Oxmaint's CMMS connects HVAC asset health, maintenance history, and operational data in one platform — giving energy managers the maintenance-side context that pure utility benchmarking tools miss. When an EUI spike appears in the dashboard, Oxmaint shows whether a coil cleaning was overdue, a filter was past interval, or a thermostat calibration was missed. Book a Demo to see how maintenance history and energy performance connect inside Oxmaint.
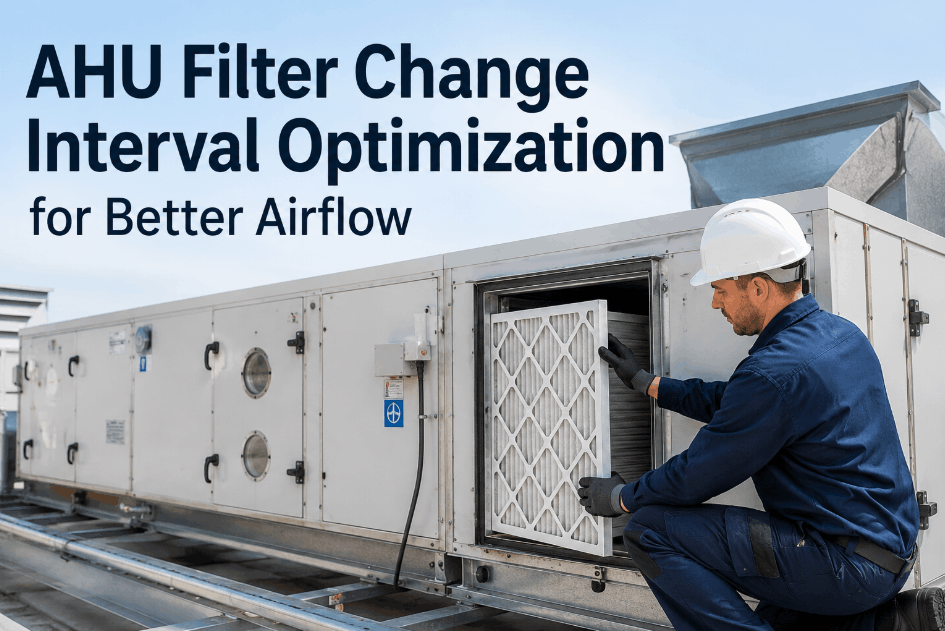
Preventive Maintenance Scheduling
Auto-scheduled coil cleaning, filter changes, and calibration tasks ensure HVAC systems run at design efficiency — directly supporting energy benchmark targets.
Analytics & Reporting
Portfolio-level dashboards track HVAC runtime, work order completion rates, and maintenance compliance — all factors that correlate with energy performance gaps.
Predictive Maintenance
Condition-based alerts from sensor integrations flag developing faults before they degrade efficiency — catching refrigerant loss, coil fouling, and drive faults early.
Asset Management
Full asset lifecycle tracking identifies which HVAC units are aging past design efficiency thresholds, supporting replacement prioritization and capital planning decisions.
Connect Maintenance Performance to Energy Benchmarking
Oxmaint's CMMS tracks HVAC maintenance compliance, asset health, and work order history — giving your energy benchmarking program the operational context that utility bills alone can't provide.
Frequently Asked Questions — HVAC Energy Benchmarking
What is HVAC Energy Use Intensity (EUI) and how is it calculated?
EUI is total HVAC energy consumed (kBtu) divided by gross floor area (sq ft) per year. It normalizes for building size, allowing fair comparison across a portfolio. Climate-zone adjustment further normalizes for local weather severity.
Which ASHRAE climate zone has the highest HVAC energy benchmarks?
Zones 6–8 (cold and subarctic) carry the highest heating loads. Zones 1–2 (hot-humid) carry the highest cooling loads. Both extremes result in elevated EUI compared to temperate Zone 4–5 benchmarks.
How does poor HVAC maintenance affect energy benchmarking scores?
Dirty coils, clogged filters, and refrigerant faults typically add 10–20% to HVAC energy consumption. This directly inflates EUI scores and makes buildings appear as underperformers even when the envelope and system design are sound.
Can Oxmaint help identify which HVAC assets are responsible for energy benchmark gaps?
Yes. Oxmaint links maintenance history, runtime data, and work order records to individual assets — making it possible to identify which units have overdue PM tasks correlating with energy performance gaps.
How often should HVAC energy benchmarking be reviewed?
Monthly utility tracking with quarterly building-level EUI review is best practice. Annual portfolio ranking with peer benchmarking drives capital and operational improvement planning.
Benchmark Smarter. Maintain Better. Spend Less on HVAC Energy.
Oxmaint connects HVAC preventive maintenance, asset health, and operational analytics so your energy benchmarking program has the maintenance context it needs to drive real reductions.