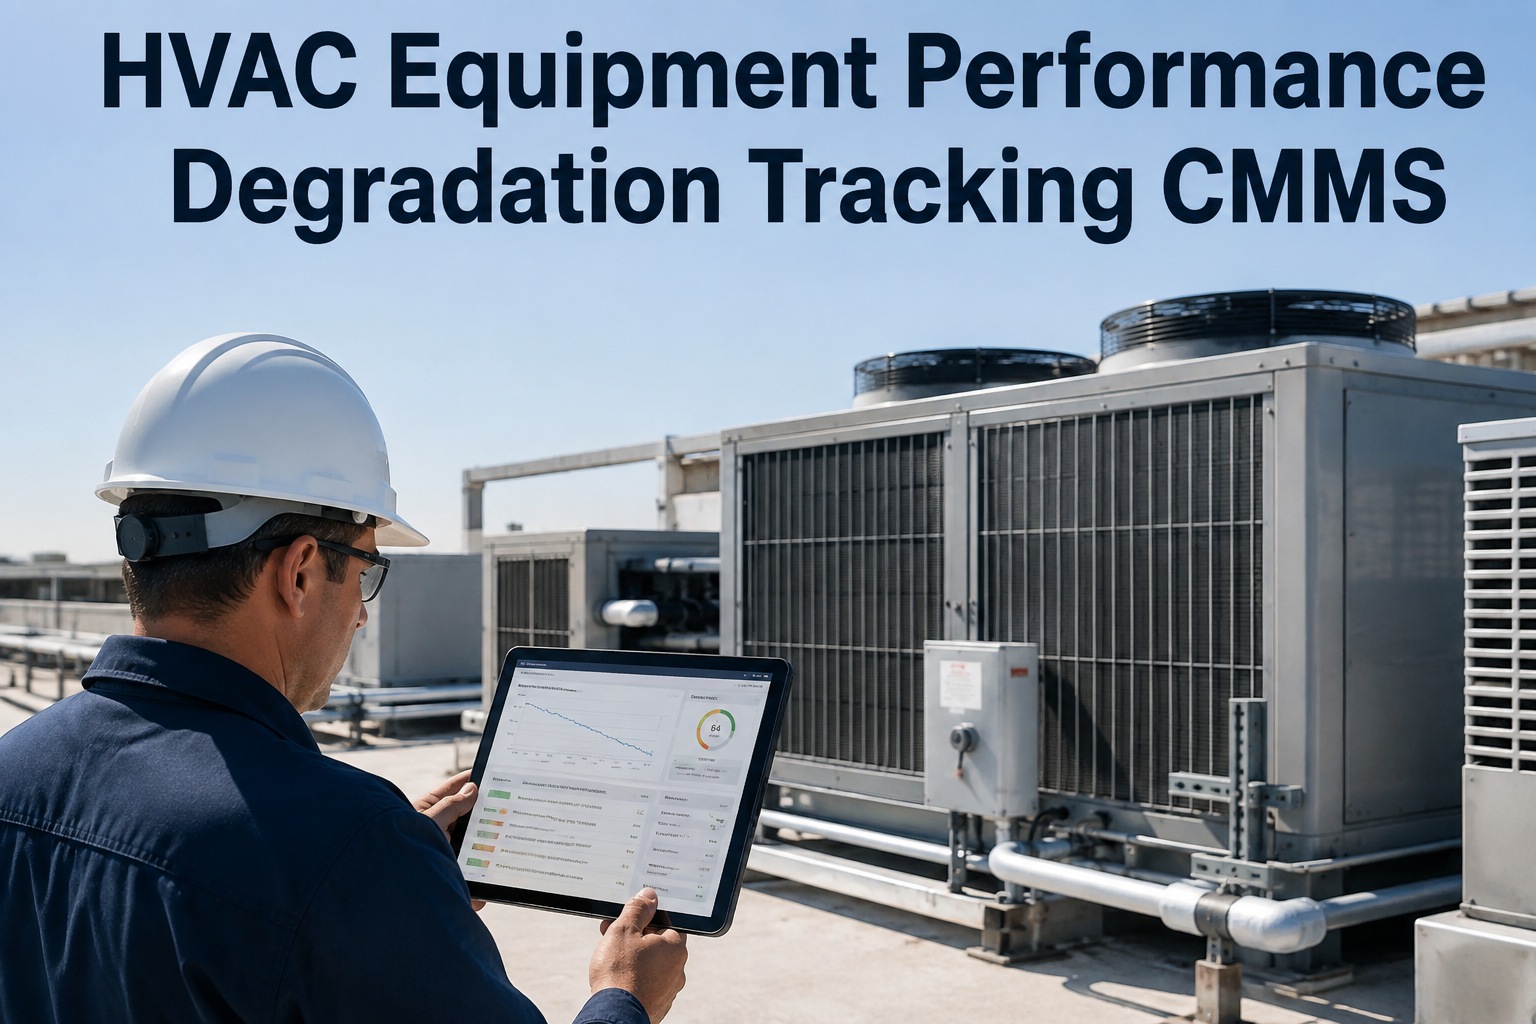
HVAC performance degradation tracking is the practice of measuring efficiency decline in heating, ventilation, and air conditioning equipment over its useful life — comparing current operating metrics against a healthy baseline to detect wear, fouling, and impending failure before they escalate. A CMMS with degradation curve analytics turns scattered work-order data and sensor readings into visible performance trends, so maintenance and reliability teams can shift from reactive repairs to predictive, condition-based interventions. This guide walks through baseline benchmarking, degradation curve analysis, and the KPIs that matter for HVAC asset decline in 2026 — and shows how an AI-powered platform like OxMaint makes it actionable. Ready to stop guessing and start trending? Start Free Trial and see your equipment data come alive.
HVAC DEGRADATION GUIDE 2026
Is your HVAC equipment silently losing efficiency — right now?
Most facilities don't notice HVAC performance degradation until energy bills spike by 20–30% or a critical compressor fails in peak summer. By the time efficiency decline is visible on a utility invoice, the asset has already been degrading for months. A CMMS-based degradation curve catches the slide early — trending kWh, run-hours, vibration, and delta-T against baseline so you can intervene while the fix is still cheap.
BASELINE & TRENDING
What drives HVAC performance degradation — and why you need a baseline
Every HVAC asset starts life at a nameplate efficiency rating — AHRI-rated EER, IEER, COP, or kW/ton for chillers. From the moment it is commissioned, real-world forces begin eroding that rating: condenser fouling, refrigerant leakage, bearing wear, filter loading, and coil corrosion each shave percentage points off performance. The Department of Energy estimates that unmaintained HVAC systems consume 15–35% more energy than well-maintained peers of the same age. Without a documented baseline and continuous trending, that slow efficiency decline is invisible until a comfort complaint, a failed component, or a budget overrun exposes it.
Typical for a chiller with no condition monitoring — fouling and refrigerant log drift compound yearly.
Share of unplanned HVAC failures avoidable when degradation is trended and caught in the early curve.
Every kWh saved by restoring a degrading unit to baseline flows straight to the utility budget bottom line.
DEGRADATION CURVE ANALYSIS
How to build an HVAC degradation curve in a CMMS
A degradation curve plots a performance metric — typically kW/ton, EER, or COP — against time or run-hours, then compares the trend to the asset's commissioned baseline. The curve reveals three phases: a brief break-in period, a long slow-decline plateau, and an accelerating cliff where failure becomes imminent. OxMaint's CMMS performance degradation module automates this by ingesting meter readings, BMS data points, and work-order measurements, then rendering a live curve per asset so reliability teams can see exactly where each unit sits on its life trajectory.
Establish the baseline
Record nameplate EER/COP, commissioning test data, baseline vibration spectra, refrigerant charge, and clean-coil delta-T. OxMaint stores these as the asset's golden reference in the equipment record.
Trend performance quarterly
Log kW/ton, approach temperatures, filter pressure drop, and bearing vibration at consistent intervals. OxMaint plots each reading against the baseline curve and flags deviations exceeding configurable thresholds.
Detect the inflection point
When the trend line bends steeper than the expected 1–2% annual decline, the AI engine flags the asset for predictive review — triggering a targeted inspection work order before efficiency collapses.
Decide: restore, refurbish, or replace
OxMaint's lifetime cost analytics compare the cost of a restoration (coil cleaning, refrigerant top-up, bearing swap) against projected energy waste and remaining useful life — giving you a data-backed capex vs opex decision.
FORMULA & METRICS
Key formulas for quantifying HVAC efficiency decline
To track HVAC asset decline objectively, reliability engineers rely on a small set of standard formulas. OxMaint calculates each automatically from logged readings and work-order data, but understanding the math helps teams set meaningful alert thresholds.
Expresses efficiency loss as a percentage of original rated performance. A chiller rated at 0.55 kW/ton now drawing 0.71 kW/ton has a 29% degradation rate.
A ratio above 1.0 signals the unit is consuming more energy per ton of cooling than designed. OxMaint flags any asset exceeding a PI of 1.15 for review.
| Equipment Type | Baseline Metric | Alert Threshold | Critical Threshold |
|---|---|---|---|
| Centrifugal Chiller | 0.55 kW/ton | +10% (0.61 kW/ton) | +20% (0.66 kW/ton) |
| RTU / Package Unit | 11.5 EER | −8% (10.6 EER) | −15% (9.8 EER) |
| Cooling Tower | 5°C approach | +1.5°C (6.5°C) | +3°C (8°C) |
| AHU Fan Motor | 0.85 kW per 1000 CFM | +12% | +25% |
| Boiler (Hot Water) | 82% combustion eff. | −3 pts (79%) | −6 pts (76%) |
HOW OXMAINT HELPS
CMMS degradation tracking capabilities that stop the slide
OxMaint turns the theory above into a live, automated system. Instead of logging readings in spreadsheets and hoping someone notices a trend, every measurement flows into a single asset record — and the AI engine does the comparison for you. Here is how four core capabilities map directly to HVAC performance degradation tracking:
Baseline & threshold engine
Store nameplate and commissioning data per asset; OxMaint auto-compares every logged reading against the baseline and fires alerts at configurable deviation percentages — no manual charting required.
Predictive degradation alerts
Machine-learning models analyse vibration, temperature, and energy-consumption trends to predict when an asset will cross its critical threshold — generating a priority work order before failure occurs.
Automated PM triggers by condition
Instead of rigid calendar-based PMs, OxMaint triggers coil cleaning, filter changes, and bearing lubrication when degradation metrics hit alert level — so maintenance happens when the asset actually needs it.
Lifecycle cost & replacement analytics
OxMaint tallies energy waste from degradation, cumulative repair cost, and remaining useful life into a single replacement-recommendation dashboard — giving you the capex justification data auditors and finance teams expect.
WORKED EXAMPLE
A 180-asset plant, $42K in recoverable energy waste
Consider a 180-asset manufacturing facility running two 500-ton centrifugal chillers, 40 RTUs, 25 AHUs, and supporting pumps and cooling towers. The energy manager notices summer utility bills creeping up year over year but can't pinpoint which units are responsible. After implementing OxMaint's CMMS degradation tracking, the reliability team logs quarterly kW/ton, approach temperature, and filter pressure-drop readings for every cooling asset. Within 60 days, the degradation curves reveal:
Chiller #2 had drifted to 0.68 kW/ton (24% degradation) from a 0.55 baseline — fouled condenser tubes and low refrigerant charge. A $3,200 tube cleaning and refrigerant top-up restored it to 0.57 kW/ton.
Performance trending caught efficiency decline in 14 RTUs before summer peak — scheduling cleanings in the off-season avoided $8,500 in premium-rate emergency service calls.
Vibration trending on AHU-07's supply fan showed bearing wear accelerating past the inflection point. OxMaint's replacement analytics justified a planned $11K motor and bearing swap before a catastrophic failure cost $28K+ in downtime.
"We were flying blind on equipment health — chasing comfort complaints and paying premium rates for emergency HVAC repairs. OxMaint's degradation curves gave us a visual early-warning system. We caught a chiller that had quietly lost 24% efficiency and recovered $42K in annual energy waste with a $3K cleaning." — Facilities Director, 450,000 sq ft manufacturing plant
See your HVAC degradation curves — before the next failure
Book a 30-minute demo and we'll load a sample asset portfolio that shows exactly how OxMaint surfaces efficiency decline, triggers condition-based PMs, and justifies capex decisions with data.
FAQ
HVAC performance degradation tracking — your questions answered
What is HVAC performance degradation tracking?
It is the practice of continuously measuring an HVAC asset's operating efficiency — typically kW/ton, EER, COP, or approach temperature — and comparing each reading against the unit's commissioned baseline to quantify how much performance has declined over time. A CMMS like OxMaint automates this by plotting a live degradation curve per asset, so reliability teams can see the trend, set alert thresholds, and trigger maintenance before efficiency collapses or a component fails.
How does a CMMS detect equipment performance decline?
A CMMS ingests performance readings from manual log entries, BMS/BACnet integrations, or IoT sensors and stores them against the asset record. The system then compares each reading to the baseline and to previous readings; when the deviation exceeds a configured threshold — say, a 10% drop in EER or a 1.5°C rise in cooling-tower approach — it auto-generates an alert or a work order. OxMaint adds an AI layer that analyses the slope of the trend line to predict when the asset will cross its critical threshold, giving you weeks of lead time. Book a Demo to see the prediction engine on live data.
What metrics should I track for HVAC degradation?
The core metrics are kW/ton or COP for chillers, EER or IEER for unitary equipment, approach temperature for cooling towers and condensers, filter pressure drop for AHUs, vibration spectra for rotating equipment, and refrigerant charge level for compression-cycle units. Tracking run-hours alongside these lets you normalise the data and compare assets of different ages. OxMaint's equipment templates come pre-configured with the right metric set for each HVAC asset class, so you can start trending on day one.
How much does HVAC efficiency decline cost per year?
An unmaintained chiller typically loses 5–8% efficiency per year, translating to thousands of dollars in additional energy spend depending on tonnage and operating hours. For a 500-ton chiller running 3,500 hours per year at $0.12/kWh, a 20% degradation from baseline adds roughly $15,000–$18,000 in annual energy waste. Across a portfolio of 50–100 HVAC assets, recoverable losses routinely exceed $40,000–$80,000 per facility — money that degradation tracking in a CMMS recovers by triggering timely coil cleaning, refrigerant correction, and bearing service.
Can I switch from spreadsheet tracking to a CMMS easily?
Yes — OxMaint is designed for teams moving off Excel log sheets, paper work orders, or standalone BMS dashboards. You can import existing asset lists, baseline readings, and PM schedules via CSV upload; the system maps them to standard equipment templates and starts generating degradation curves immediately. Most teams are fully operational within 2–4 weeks, and OxMaint's onboarding team handles data migration and threshold configuration at no extra cost. Start Free Trial to test the import workflow on your own asset data.
Stop guessing about equipment health. Start trending it.
Every day without degradation tracking is a day your chillers, RTUs, and AHUs may be quietly wasting energy and sliding toward failure. OxMaint's AI-powered CMMS gives you the baseline, the curve, and the predictive alerts to act first — all in one platform.
Free 14-day trial · No credit card