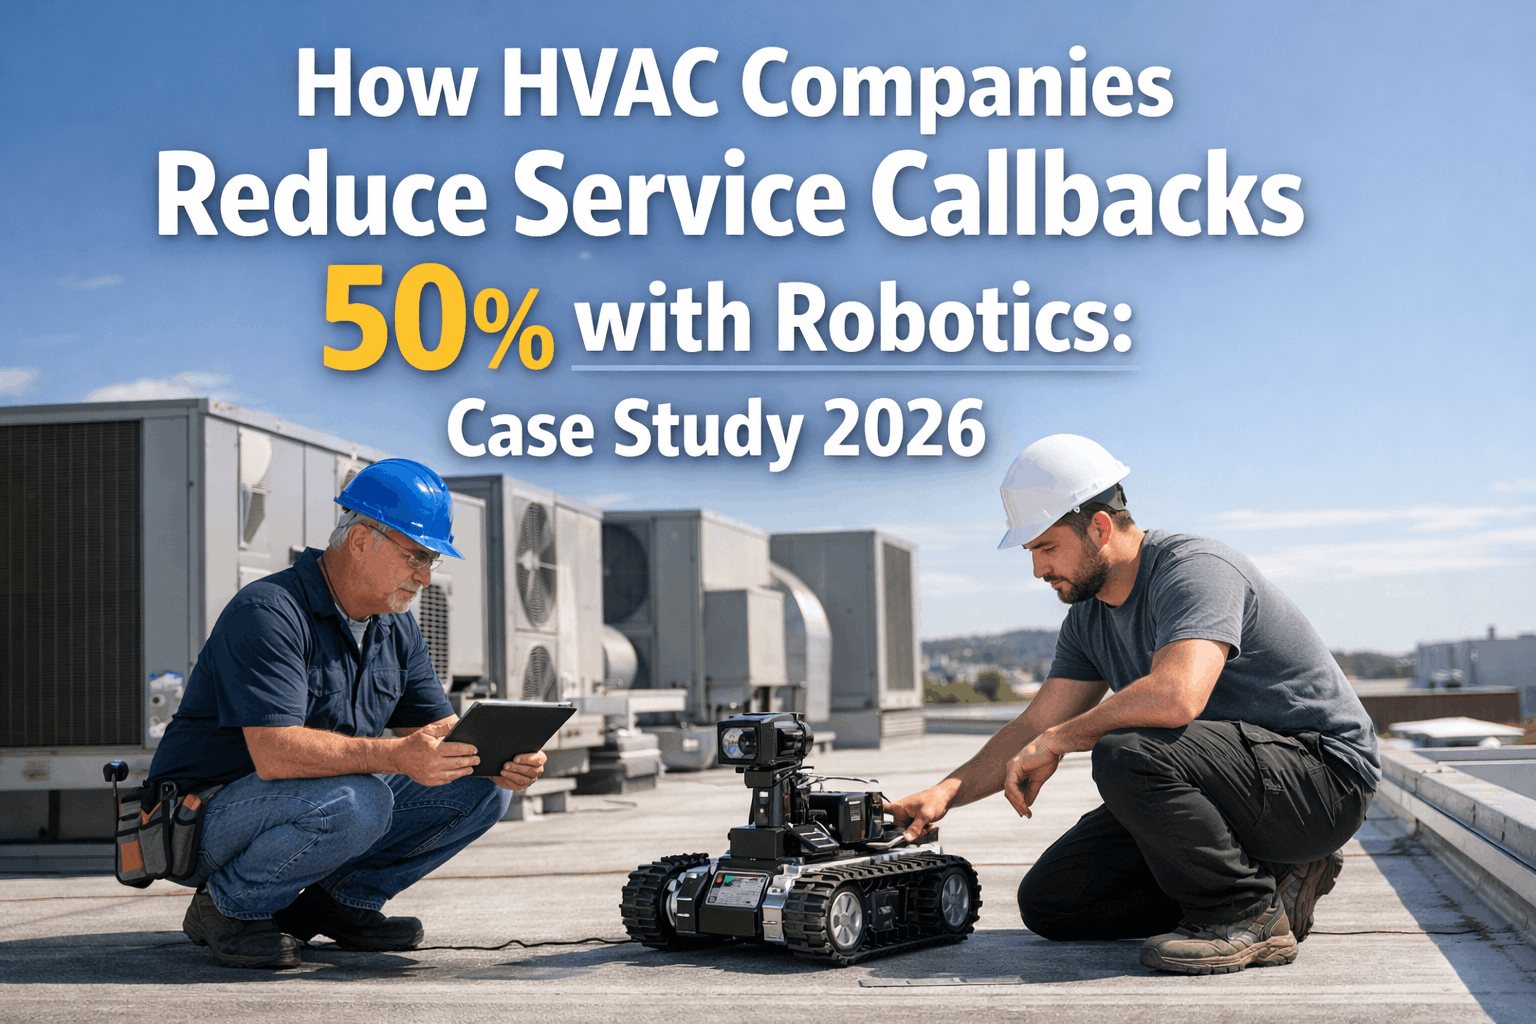
Service callbacks are the silent margin killer in commercial HVAC. Every time a technician returns to a job site to re-diagnose a compressor that was "fixed," re-tighten a flare fitting that was "verified," or chase a comfort complaint that was "resolved," the company absorbs truck rolls, labour hours, refrigerant, and parts — with zero new revenue attached. Industry data shows the average HVAC service company loses 18–24% of gross profit to callbacks, and the problem compounds as equipment complexity outpaces technician experience levels.
In 2026, a growing number of commercial HVAC companies are deploying robotic inspection, diagnostic, and verification tools that catch the errors human senses miss — cutting callback rates by 50% or more within the first year of adoption. This case study examines how robotics-assisted service workflows are eliminating the root causes of callbacks across leak detection, airflow verification, refrigerant charge confirmation, and ductwork inspection — backed by real performance data from early adopters. Oxmaint integrates robotic diagnostic outputs with work order management, technician dispatch, and customer reporting — giving HVAC service companies a single platform to track every job from first call through verified resolution. Start free trial today.
Industry Case Study 2026
How HVAC Companies Reduce Service Callbacks 50% with Robotics
Service callbacks drain profit, damage customer trust, and burn technician morale. This case study documents how commercial HVAC companies are deploying robotic diagnostic and verification tools — from autonomous leak sniffers to AI-powered airflow mappers — to eliminate the root causes of repeat visits, cut callback rates in half, and turn first-time fix rates into a competitive advantage.
$485Average Cost Per Callback
22%Avg Callback Rate Industry-Wide
50%+Callback Reduction with Robotics
3.2 moAvg Payback on Robot Investment
$31K
Average annual callback cost per technician for a 20-truck commercial HVAC operation
3.6 visitsAverage callbacks per technician per month across the commercial HVAC industry
68%Of callbacks traced to incomplete diagnostics, not faulty parts or poor workmanship
2.4 hrsAverage labour time consumed per callback — time that generates zero new revenue
Key Finding
68% of HVAC service callbacks are caused by incomplete diagnostics — not faulty parts, not poor workmanship, but missed secondary issues that only surface after the technician leaves. Robotic tools catch these hidden failures during the original visit by scanning beyond what human senses can detect: micro-leaks below sniffer thresholds, airflow imbalances invisible to feel, and charge deviations too small for gauge-only verification.
Sign Up Free
Callback Maturity Spectrum: Where Does Your Company Sit?
HVAC service companies fall into three tiers when it comes to callback management. The majority remain in the "Reactive" category — tracking callbacks only when customers complain, with no root-cause analysis or diagnostic verification protocols. Companies deploying robotic tools are reaching the "Verified" tier where every repair is confirmed by instrument or sensor data before the technician leaves the site.
Reactive (No Verification)
52%
Structured (Checklist-Based)
34%
Verified (Robotics-Assisted)
14%
The Five Root Causes Robotics Eliminate
Callback analysis across thousands of commercial HVAC service records reveals that the vast majority of repeat visits cluster around five failure categories — all of which are addressable with robotic diagnostic and verification tools available in 2026. Eliminating these root causes is how early adopters are achieving 50%+ callback reductions within their first year of deployment.
Top 5 Callback Root Causes & Robotic SolutionsCase Study Data
01 — 27% of Callbacks
Undetected Refrigerant Leaks
Technician tops off charge but misses micro-leak at a brazed joint or valve stem. System loses charge again within weeks. Customer calls back with same complaint. Robotic patrol sniffers detect leaks at PPB sensitivity — 100x more sensitive than handheld detectors.
#1 Callback Driver
02 — 21% of Callbacks
Airflow Imbalances
Comfort complaint resolved at thermostat but underlying duct obstruction, damper malfunction, or coil fouling creates uneven temperature distribution. 3D duct scanning robots and AI airflow mappers reveal distribution problems invisible to manual checks.
Comfort Failure
03 — 18% of Callbacks
Incorrect Charge Levels
Gauge-only charging in variable conditions leads to over- or under-charge. System efficiency degrades, compressor runs hot, customer reports poor performance within days. Robotic verification tools confirm subcooling, superheat, and charge weight with ±0.5°F accuracy.
Efficiency Loss
04 — 14% of Callbacks
Electrical Connection Failures
Loose contactor, corroded terminal, or failing capacitor passes visual inspection but fails under load within days. Thermal imaging robots and automated electrical scanning catch hot spots, resistance anomalies, and micro-arcing before they cause system failure.
Safety Risk
05 — 12% of Callbacks
Drainage & Condensate Issues
Condensate drain cleared but secondary blockage, cracked pan, or improper slope creates repeat water damage. Miniature pipe-crawling robots with cameras verify drain line integrity from trap through discharge — catching issues hidden behind walls and above ceilings.
Property Damage
Combined Impact
92% of Callbacks Addressable
These five root causes account for 92% of commercial HVAC service callbacks. Deploying robotic tools that address even two or three of these categories delivers measurable callback reduction within 90 days of adoption. The remaining 8% are genuine part failures and one-off anomalies.
Total Addressable
Robotic Tools Deployed by Case Study Companies
The HVAC companies achieving 50%+ callback reductions are not deploying a single magic-bullet robot. They are building a toolkit of specialised robotic instruments — each addressing a specific callback root cause — and integrating their outputs into standardised service verification workflows through their CMMS platform.
Detection
Autonomous Leak Patrol Robots
Post-Repair Verification
Mobile robots with onboard IR spectroscopy that verify leak repairs by scanning the entire system — not just the repaired joint — before the technician leaves. Catches secondary leaks missed during focused repair work.
PPB SensitivityFull-System Scan5 min. VerifyPhoto Evidence
Airflow
AI Airflow Mapping Systems
Comfort Complaint Resolution
Sensor arrays deployed at supply and return registers that build a real-time airflow map of the served space. AI identifies distribution imbalances, duct restrictions, and damper failures that manual anemometer spot-checks miss.
Multi-Zone MapAI AnalysisBefore/AfterPDF Report
Imaging
Thermal Imaging Crawlers
Electrical & Mechanical Scan
Compact robots that navigate equipment enclosures and electrical panels capturing high-resolution thermal imagery. Auto-flag hot connections, failing components, and heat distribution anomalies that visual inspection cannot detect.
0.03°C ResolutionAuto-FlagPanel SafeCMMS Upload
Duct
Duct Inspection Crawlers
Obstruction & Condition Check
LiDAR-equipped crawlers that traverse ductwork interiors to verify cleanliness, find obstructions, measure leakage, and confirm damper operation. Eliminates the guesswork in airflow-related comfort complaints.
±2 mm ScanObstruction IDLeak Measure3D Model
Charge
Automated Charge Verification
Every Refrigerant Service Call
Smart manifold systems with robotic sensor arrays that continuously monitor subcooling, superheat, and system pressures under load — confirming proper charge with ±0.5°F accuracy and generating tamper-proof verification records.
±0.5°F AccuracyAuto-LogLoad-VerifiedDigital Cert
Drain
Micro Pipe Inspection Robots
Condensate Line Verification
Miniature camera-equipped crawlers that navigate condensate drain lines from trap through discharge. Verify full line integrity, proper slope, and absence of secondary blockages that manual flushing cannot confirm.
¾ in. Min. PipeHD Camera30 ft. RangeVideo Record
Before & After: Case Study Performance Data
The following results are aggregated from four commercial HVAC service companies ranging from 12 to 85 trucks, operating across different U.S. regions, all of which deployed robotic verification tools into their standard service workflows during 2025. The data covers a minimum 12-month comparison window.
12-Month Performance Comparison: Pre- vs. Post-Robotics Deployment
Before Robotics
Callback Rate22%
First-Time Fix Rate72%
Avg Diagnostic Time48 min
Customer Satisfaction3.6 / 5.0
Annual Callback Cost$620K (50-truck)
After Robotics
Callback Rate11%
First-Time Fix Rate89%
Avg Diagnostic Time32 min
Customer Satisfaction4.6 / 5.0
Annual Callback Cost$298K (50-truck)
Pro Tip
The companies with the fastest callback reduction did not deploy all six robot categories at once. They started with autonomous leak verification and thermal imaging — the two tools addressing 41% of callbacks — and expanded from there. Starting with the highest-impact category produces measurable results within 90 days and builds team confidence for the next phase.
Book a Demo
Severity Scale: Rating Callback Impact
Not all callbacks carry equal business damage. A minor thermostat recalibration is an inconvenience; a repeat compressor failure that floods a tenant suite is a relationship-ending event. This severity scale helps service managers classify, prioritise, and track callback impact — and measure the specific categories where robotic tools deliver the greatest reduction.
5
Critical Failure
Complete system down, property damage, or safety hazard. Customer escalation to management. Contract at risk. Emergency dispatch required.
4
Performance Loss
System running but comfort not maintained. Tenant complaints. Building manager involved. Same-day return visit required.
3
Efficiency Degradation
System operating but at reduced efficiency. Higher energy use noticed. Scheduled return visit within 1-2 days acceptable.
2
Minor Adjustment
Setpoint correction, sensor recalibration, or control parameter tweak. Customer inconvenienced but not distressed. Flexible scheduling.
1
Cosmetic / Nuisance
Minor noise, display glitch, or aesthetic concern. No impact on comfort or safety. Can be addressed during next scheduled visit.
The Escalating Cost of Callbacks Left Unchecked
Every callback that reaches a customer is just the visible tip of the iceberg. Below the surface sit the hidden costs — warranty absorption, technician burnout, scheduling disruption, lost upsell opportunities, and the reputational damage that quietly drives contract non-renewals. Robotic verification tools break this cycle at the source.
$8K - $25K
Robotic Tool Investment
One-time cost for a starter robotic verification toolkit (leak sniffer + thermal imager). Pays for itself by eliminating 8–12 callbacks per technician per year. Adds verification evidence to every service report.
Payback: 3.2 Months
$31K / tech
Annual Callback Cost
Average per-technician annual cost including truck roll, labour, parts, refrigerant, and scheduling disruption. For a 50-truck operation: $620,000/year in pure callback expense with zero revenue recovery.
Frequency: Ongoing
$150K+
Contract Loss
High callback rates trigger contract non-renewals, negative reviews, and lost referrals. A single lost property management contract can exceed $150K in annual revenue — often traceable to chronic callback complaints.
Frequency: Relationship-Ending
Turn Every Service Call into a Verified, One-Trip Resolution
Oxmaint connects robotic diagnostic outputs to work orders, technician dispatch, customer reporting, and callback analytics — giving HVAC service companies the platform to track every job from first call through verified resolution and prove first-time fix rates to customers.
KPIs the Case Study Companies Track
Callback rate is the headline metric, but the companies achieving the best results track a broader set of KPIs that reveal whether robotic tools are actually changing technician behaviour, improving diagnostic quality, and translating into business outcomes — not just producing data that nobody acts on.
89%
First-Time Fix Rate
Target: 85%+. Industry average without robotics: 72%. Measured as jobs with zero callbacks within 30 days of service.
<11%
Callback Rate
Target: below 12%. Industry average: 22%. Track by technician, equipment type, and service category to identify patterns.
95%+
Verification Rate
Percentage of service calls with robotic verification evidence attached. Below 80% means tools are in the truck but not being used consistently.
4.6 / 5
Customer Satisfaction
Post-service survey score. Robotics-verified companies average 4.6 vs. 3.6 industry baseline. Customers cite "thoroughness" and "proof of repair."
Your 6-Month Callback Reduction Roadmap
You do not need to equip every truck with every robot on day one. The case study companies all followed a phased rollout that proved ROI on a pilot group, built technician confidence, and scaled based on measured callback reduction — not vendor promises.
From High Callbacks to Verified First-Time Fixes: Implementation Timeline
Weeks 1-4
Baseline & Root Cause Analysis
Pull 12-month callback data and categorise by root cause, severity, equipment type, and technicianCalculate true callback cost including labour, parts, truck roll, scheduling disruption, and lost revenueIdentify your top 2–3 callback categories that robotic tools can address immediately
Weeks 5-10
Pilot Deployment
Equip 3–5 technicians with robotic verification tools targeting your top callback categoriesBuild standardised verification workflows in your CMMS — mandatory scan before job close-outConfigure auto-attached verification evidence (scan results, thermal images) to every work order
Weeks 11-16
Measure & Refine
Compare pilot group callback rates against control group and pre-deployment baselineIdentify which verification steps catch the most issues and refine workflows accordinglyTrain pilot technicians to become peer trainers for the next deployment wave
Weeks 17-26+
Scale & Expand
Roll out robotic verification tools to all technicians based on proven pilot resultsAdd robotic tools for additional callback categories (duct scanning, drain inspection, charge verification)Integrate callback analytics into customer reporting — prove first-time fix rates to win and retain contracts
CMMS Features That Make Robotics Work
Robotic tools without a connected platform are just expensive gadgets. The callback reduction only sticks when verification data flows into a CMMS that enforces scan-before-close workflows, tracks verification compliance by technician, and turns callback patterns into actionable coaching and training insights.
A
Mandatory Verification Gates
Work orders cannot be closed until robotic verification evidence is attached — scan results, thermal images, airflow maps, or charge confirmation reports. Eliminates "I checked it" without proof.
B
Callback Root Cause Analytics
Automated classification of every callback by root cause category, severity tier, equipment type, and technician. Dashboard reveals patterns that guide tool investment, training priorities, and workflow refinements.
C
Technician Performance Scorecards
Individual first-time fix rates, callback rates, verification compliance scores, and average diagnostic times — visible to the technician and their supervisor. Data-driven coaching replaces guesswork performance reviews.
D
Customer Verification Reports
Auto-generated service reports with embedded robotic scan evidence, thermal images, and before/after measurements. Customers see proof of thorough work — building trust that drives renewals and referrals.
E
Equipment Failure Pattern Library
Robotic scan data accumulated across thousands of service calls builds an equipment-specific failure pattern library. CMMS surfaces known issues for specific make/model/age combinations, helping technicians look in the right places first.
F
Callback Financial Impact Tracker
Real-time dashboard showing callback costs by month, category, technician, and customer account. Translates callback reduction directly into profit recovery — the number your CFO and ownership care about most.
Your Callbacks Are Costing More Than You Think
The case study companies cut callbacks 50% within 12 months — and the investment paid for itself in 3.2 months on average. Oxmaint gives your team the platform to connect robotic verification data to every work order, track callback patterns, and prove first-time fix rates to the customers who decide whether to renew your contracts.
Frequently Asked Questions
Q. How long does it take to see callback reduction after deploying robotic tools?
Most companies see measurable callback reduction within 60–90 days of pilot deployment. The fastest improvements come from leak verification and thermal imaging, which address 41% of callback root causes. Full 50%+ reduction typically materialises by month 9–12 as verification workflows become standard practice across all technicians.
Schedule a demo to model expected timeline for your team size and callback profile.
Q. Do technicians resist using robotic verification tools?
Initial resistance is common — experienced technicians feel their skills are being questioned. The case study companies overcame this by framing robots as "proof of good work" rather than "checking up on you." When technicians saw that verification evidence eliminated disputed callbacks and supported their warranty claims, adoption accelerated. Within 90 days, most technicians reported preferring the tools because they reduced return trips and customer complaints.
Sign up for Oxmaint to see how verified work orders build technician confidence.
Q. What is the total investment for a starter robotic verification toolkit?
A basic two-tool kit (autonomous leak sniffer + handheld thermal imaging robot) ranges from $8,000 to $25,000 depending on sensitivity level and features. At a 50% callback reduction rate and $485 average callback cost, a single technician running 3.6 callbacks per month recovers the investment in approximately 3.2 months. Multi-tool kits adding airflow mapping and charge verification range from $30,000 to $65,000 per technician.
Q. Can robotic tools work with our existing CMMS or do we need to switch platforms?
Most robotic diagnostic tools output data in standard formats (PDF reports, CSV logs, image files) that can attach to work orders in any CMMS. However, the full callback reduction workflow — mandatory verification gates, auto-classification, technician scorecards, and customer reporting — requires a CMMS with these specific features built in.
Book a demo to see how Oxmaint's verification workflow integrates with robotic tool outputs.
Q. How do we get ownership buy-in for robotic tool investment?
Present three numbers: current annual callback cost (technicians × 3.6 callbacks/month × $485 × 12), projected 50% savings from robotic verification, and payback period (typically 3–4 months). Then add the revenue protection angle — quantify contracts at risk from high callback rates and the lifetime value of customer retention improvements. A 90-day pilot on your highest-callback technician team makes the case with your own data, not industry averages.