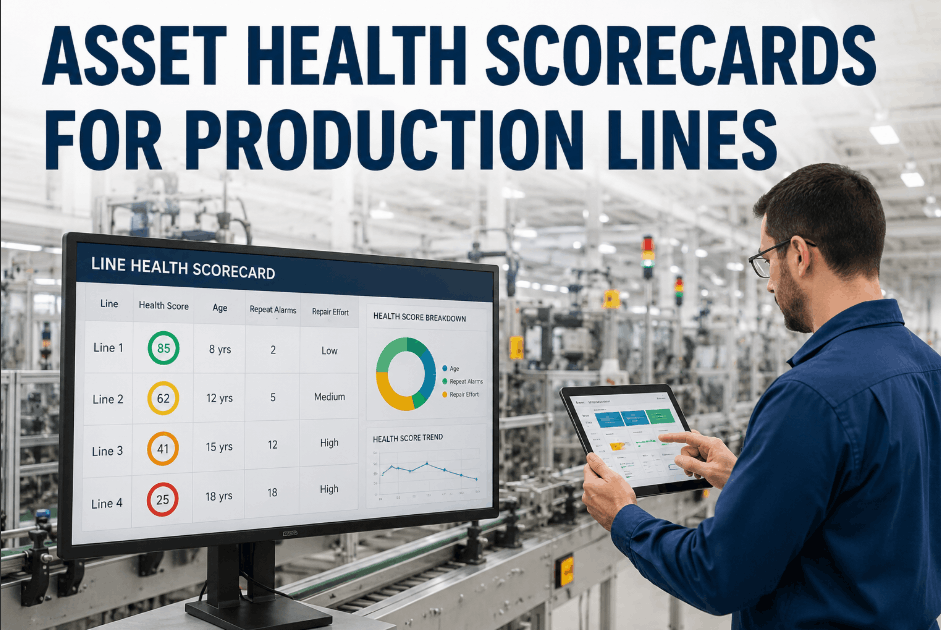
Production line planners make equipment prioritization decisions every day — which assets get scheduled maintenance attention this week, which can be deferred, which need accelerated inspection. Without a structured health score for each asset, those decisions rely on maintenance history recall and technician intuition rather than evidence. Asset health scorecards aggregate age, repeat alarm frequency, and repair effort into a ranked health index per asset — giving planners a quantified view of which equipment is degrading fastest and where maintenance investment will have the greatest impact on line reliability. Sign Up Free to connect your asset records and maintenance history to Oxmaint and begin generating health scores for your production line equipment. Oxmaint AI builds asset health scorecards from work order history, alarm records, and repair effort data — giving maintenance planners and reliability engineers the ranked asset intelligence needed to prioritize before failure rather than respond after it. Book a Demo to see how Oxmaint generates asset health scorecards from your existing maintenance records.
Know Which Assets Are Slipping Before They Stop Your Line
Oxmaint AI scores asset health across production lines using age, repeat alarms, and repair effort — giving planners the ranked equipment intelligence to prioritize maintenance where degradation is accelerating fastest.
Why Asset Health Scoring Is Missing from Most Production Line Maintenance Programs
Gap #1
No Composite Health Index per Asset
Age, alarm history, and repair effort are recorded separately in different modules — but are never combined into a single health score that reflects the overall condition trajectory of each asset on the production line.
Gap #2
Repeat Alarm Patterns Not Weighted
An asset generating the same alarm repeatedly signals a developing fault that individual alarm records do not surface — without repeat alarm frequency weighting, accelerating degradation looks no different from a one-time event in maintenance reports.
Gap #3
Repair Effort Trend Invisible
Total labour and parts cost per asset is tracked, but the trend in repair effort over time is not — masking assets whose increasing maintenance burden signals end-of-life approach and impending reliability deterioration.
Gap #4
No Asset-to-Asset Health Comparison
Planners cannot compare health status across assets in the same equipment class — making it impossible to identify which pump, conveyor, or drive unit within a population is degrading fastest relative to its peers.
Gap #5
Prioritization Based on Loudest Problem
Maintenance attention goes to the most recently reported fault rather than the asset with the fastest-declining health trajectory — meaning quietly degrading equipment receives no attention until failure forces an emergency response.
Gap #6
No Health Score for Capital Planning
Asset replacement and refurbishment decisions are made without quantified health data — capital plans are built on age alone rather than on a composite assessment of condition, repair burden, and reliability performance.
How Oxmaint AI Builds Asset Health Scorecards for Production Lines
01
Asset Data Aggregation
Oxmaint pulls asset age, alarm history, work order records, and repair cost data into a unified asset profile — creating the data foundation from which composite health scores are calculated per equipment unit.
→
02
Health Score Calculation
Oxmaint calculates an asset health index by weighting age against design life, repeat alarm frequency, repair effort trend, and recent work order closure rate — producing a composite score that reflects both current condition and rate of degradation.
→
03
Line-Level Ranking
Assets are ranked by health score within each production line and equipment class — enabling planners to identify the fastest-declining equipment at a glance rather than inferring condition from individual work order records.
→
04
Maintenance Prioritization Output
Oxmaint generates maintenance prioritization recommendations based on health score ranking and asset criticality — directing planning attention to equipment where intervention will have the greatest impact on line reliability before failure occurs.
What Oxmaint Captures Per Asset Health Scorecard
Age and Life Assessment
Asset age tracked against design life expectancy per equipment class
Life consumption ratio calculated as a health score input factor
Remaining useful life estimate updated as maintenance history accumulates
Alarm Performance
Repeat alarm frequency tracked and weighted in health score calculation
Alarm type distribution analyzed to identify dominant fault signals
Alarm rate trend monitored for acceleration indicating developing fault
Repair Effort
Cumulative repair labour and parts cost tracked per asset over time
Repair effort trend calculated as a health score degradation indicator
Repair-to-replacement cost ratio calculated for capital planning input
Planning Outcome
Ranked health scorecard gives planners quantified prioritization basis
Capital replacement decisions supported by health score and repair burden data
Maintenance resource allocation aligned to fastest-declining assets by score
34%
Of production line unplanned failures occur on assets whose health trajectory would have flagged accelerating degradation if scored 60 days earlier
2.6×
More effective maintenance resource allocation when planners work from ranked health scores versus reactive work order queues
48hrs
Typical Oxmaint deployment time before asset health scoring begins generating ranked scorecards from existing maintenance history
90days
Average period to establish statistically reliable health score baselines per asset class after Oxmaint scorecard deployment
Oxmaint AI vs Standard CMMS for Asset Health Visibility
Standard CMMS — Fragmented Asset Condition Data
Age, alarms, and repair records stored separately — no composite health score generated per asset
Repeat alarm patterns not weighted — individual alarm events treated identically regardless of recurrence frequency
Repair effort trend not calculated — increasing maintenance burden invisible in aggregate cost reports
No asset-to-asset health comparison within equipment class — relative degradation rate invisible to planners
Maintenance prioritization driven by most recent fault rather than fastest-declining health trajectory
Capital planning relies on age alone — no composite health score to support replacement timing decisions
Oxmaint AI — Ranked Asset Health Intelligence
Composite health score calculated per asset from age, alarms, and repair effort in a single ranked index — Sign Up Free
Repeat alarm frequency weighted in health score — accelerating fault patterns identified before failure
Repair effort trend tracked and incorporated into health score — increasing maintenance burden surfaced automatically
Assets ranked within equipment class — fastest-declining units visible at a glance for planner review
Maintenance prioritization aligned to health score ranking and asset criticality — Book a Demo to see the dashboard
Capital planning supported by repair-to-replacement ratio and remaining useful life estimate per asset
6 KPIs Behind Effective Asset Health Scorecards
These KPIs give maintenance planners and reliability engineers the metrics to identify slipping assets, allocate maintenance resources to highest-impact opportunities, and build capital plans from evidence rather than age estimates alone. Book a Demo to see how Oxmaint calculates all six from your existing work order and asset records.
KPI 01
Composite Asset Health Index
A weighted score combining age-to-design-life ratio, repeat alarm frequency, repair effort trend, and recent work order closure rate into a single health index per asset. The primary ranking metric for maintenance prioritization decisions.
Health Score
KPI 02
Repeat Alarm Rate per Asset
Number of times the same alarm type recurs on a given asset within a rolling period. High repeat alarm rates indicate an unresolved underlying fault condition that periodic maintenance has not addressed.
Alarm Pattern
KPI 03
Repair Effort Trend Index
Rolling comparison of repair labour and parts cost per asset versus the same asset's historical baseline. An upward trend in repair effort relative to baseline indicates accelerating degradation regardless of age.
Repair Burden
KPI 04
Health Score Decline Rate
Rate of change in the composite health index over rolling 30- and 90-day periods. Assets with fast-declining health scores require accelerated maintenance attention regardless of their absolute score at any single point in time.
Degradation Rate
KPI 05
Repair-to-Replacement Cost Ratio
Cumulative repair cost as a percentage of estimated replacement cost per asset. Assets exceeding the repair-to-replacement threshold present a stronger financial case for capital replacement than continued maintenance investment.
Capital Decision
KPI 06
Asset Health Scorecard Coverage Rate
Percentage of production line assets with a current composite health score based on complete age, alarm, and repair data. Coverage gaps mean planning decisions for uncovered assets remain based on experience rather than measured condition data.
Data Completeness
Industries Using Oxmaint Asset Health Scorecards
Automotive Assembly
Health Scoring for Body, Paint, and Powertrain Line Equipment
Automotive manufacturers use Oxmaint to generate health scorecards for welding robots, conveyor systems, and paint line equipment — ranking assets by composite health score to direct planned maintenance resources to lines with the fastest-declining equipment before unplanned downtime disrupts production schedule. Sign Up Free for your plant.
Process Manufacturing
Rotating Equipment Health Ranking for Continuous Operations
Chemical and refining plants use Oxmaint to score health across rotating equipment populations — pumps, compressors, and agitators — identifying units whose repair burden trend and alarm recurrence indicate approaching end-of-life before failure causes process interruption. Book a Demo for your facility.
Food and Beverage
Processing and Packaging Line Asset Health Prioritization
F&B manufacturers use Oxmaint health scorecards to prioritize maintenance on filling, sealing, and labeling equipment — ensuring that assets with declining health scores receive planned maintenance before their condition causes a line stoppage during peak production periods.
Mining and Resources
Heavy Equipment Health Scoring for Remote Asset Fleets
Mining operations use Oxmaint to maintain health scorecards for haul trucks, crushers, and conveyor drives — giving maintenance planners at remote sites a ranked view of equipment condition across the fleet so that limited maintenance windows are directed to the assets with the greatest reliability risk.
Your Planners Shouldn't Have to Guess Which Assets Are Slipping Fastest.
Oxmaint AI generates composite health scorecards from age, repeat alarm data, and repair effort — giving production line planners the ranked asset intelligence to direct maintenance resources where degradation is accelerating, before failure forces an emergency response. Book a Demo to see health scoring applied to your asset register.
Frequently Asked Questions
What is an asset health scorecard for production lines?
An asset health scorecard is a composite score per equipment unit that combines age, repeat alarm frequency, and repair effort into a single ranked index — giving maintenance planners a quantified basis for prioritizing maintenance attention rather than relying on fault recency or technician intuition.
How does Oxmaint calculate the asset health index?
Oxmaint weights age-to-design-life ratio, repeat alarm rate, repair effort trend, and recent work order closure rate into a composite health index per asset — updated continuously as new maintenance events and alarm records are added to the system.
Why is repeat alarm weighting important in asset health scoring?
A single alarm is an event; a recurring alarm is a signal of an unresolved fault condition. Weighting repeat alarm frequency in the health score ensures that assets with persistent fault patterns score lower than assets generating occasional non-recurring alarms at similar overall frequencies.
Can Oxmaint health scorecards support capital replacement decisions?
Yes. Oxmaint calculates the repair-to-replacement cost ratio per asset from cumulative work order cost data — providing the financial evidence maintenance and asset management teams need to justify capital replacement over continued maintenance investment at the right point in the asset lifecycle.
Does Oxmaint generate health scorecards across multiple production lines?
Yes. Oxmaint aggregates health scores across all production lines and sites — enabling planners to compare asset health rankings between lines, identify line-level reliability risk, and allocate maintenance resources across the facility based on composite health data rather than per-line anecdote.
Stop Waiting for Assets to Fail Before You Know They Were Slipping.
Oxmaint AI builds ranked asset health scorecards from age, alarm patterns, and repair effort — giving production line planners the evidence-based prioritization they need to intervene before degradation becomes downtime.