Not all equipment failures cost the same. A compressor failure on a primary production line is not equivalent to a conveyor fault in a buffer zone — yet many maintenance teams treat every asset with the same PM interval and the same work order priority. Asset criticality scoring gives production planners and reliability engineers a structured, defensible model to rank equipment by business impact, recovery cost, and line dependency. This is the foundation for intelligent capital planning, risk-based maintenance scheduling, and end-of-life asset roadmap decisions. Facilities that Sign Up Free on Oxmaint can build and apply criticality scoring models that automatically adjust PM intervals, work order priority, and inspection frequency based on each asset's risk rank.
Oxmaint helps reliability teams score production equipment by impact, line dependency, and lifecycle cost — then automatically prioritizes maintenance actions based on risk rank.
5 Scoring Dimensions for Production Equipment Criticality
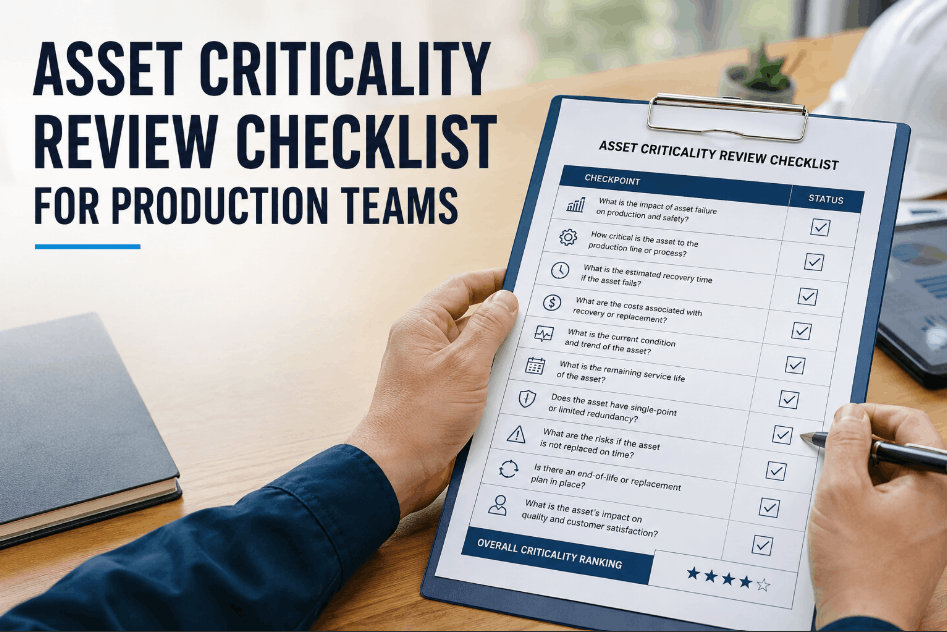
A defensible criticality scoring model evaluates assets across five weighted dimensions. Scoring on one dimension alone creates distorted rankings — a high-cost asset isn't necessarily critical if it has fast recovery options. Planners who Book a Demo with Oxmaint see how multi-dimension criticality scoring integrates directly into PM scheduling, capital planning workflows, and asset replacement timelines.
Does asset failure stop the line, reduce throughput, or trigger a quality hold? Assets that cause full line stoppages score highest. Secondary assets with bypass options score lower.
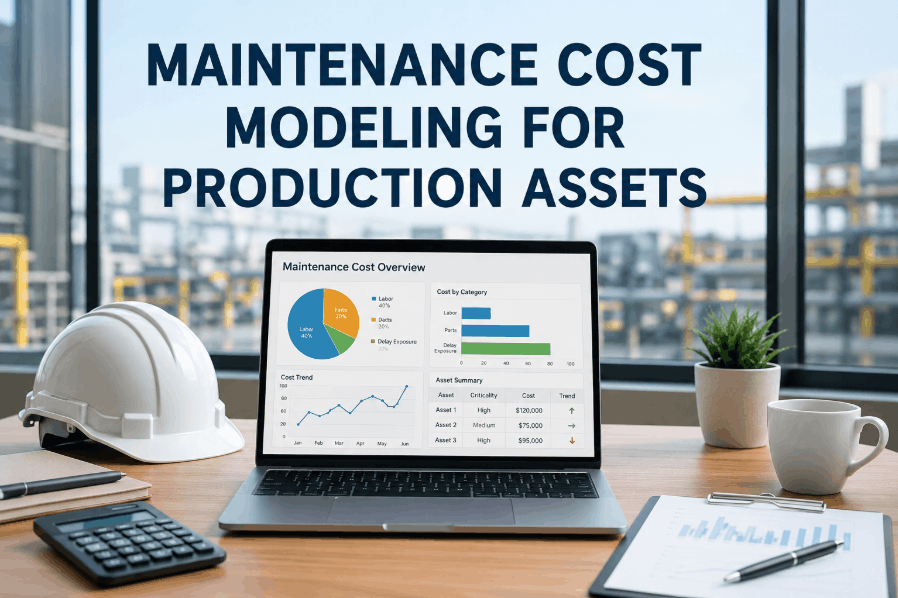
Total recovery cost includes parts, labor, expedited shipping, downtime losses, and scrap generated during failure. High recovery cost elevates criticality independent of failure frequency.
How many downstream processes depend on this asset? Single-path dependencies in production cells score maximum criticality. Redundant-path assets score lower on dependency.
Assets with rising failure frequency or degrading condition trends score higher even if past failures have been contained. Wear trend data from Oxmaint informs dynamic criticality recalculation.
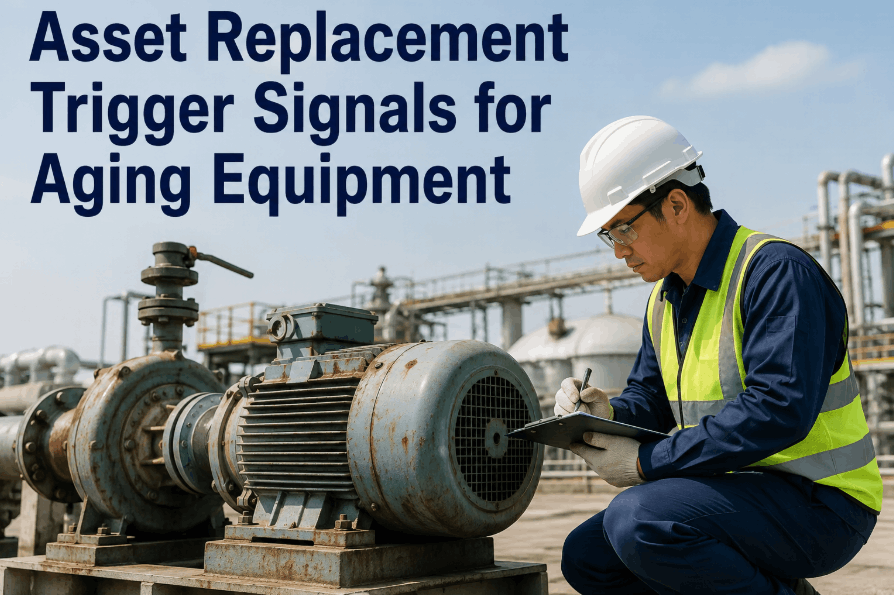
Assets nearing end of service life with high lifecycle cost accumulation carry elevated criticality. Capital planning decisions require knowing where the asset sits on its depreciation and renewal curve.
Asset Criticality Scoring Matrix for Production Equipment
This reference matrix maps scoring criteria to criticality tiers. Reliability engineers who Sign Up Free on Oxmaint apply these tiers to automate PM interval adjustment, work order priority assignment, and inspection frequency — without rebuilding logic per asset class.
| Criticality Tier | Score Range | Production Impact | Maintenance Response | Capital Planning Action |
|---|---|---|---|---|
| Tier 1 — Critical | 80–100 | Full line stoppage, no bypass | Condition monitoring + tightened PM | Priority replacement budget allocation |
| Tier 2 — High | 60–79 | Throughput reduction or quality risk | Scheduled PM with buffer parts stock | Included in 12-month asset roadmap |
| Tier 3 — Moderate | 40–59 | Partial slowdown, bypass available | Standard PM intervals | Review at annual capital planning cycle |
| Tier 4 — Low | 20–39 | Minimal throughput impact | Run-to-failure or extended PM | Deferred unless condition deteriorates |
| Tier 5 — Non-Critical | 0–19 | No direct production impact | Reactive maintenance acceptable | Budget only on failure event |
Deploying a Criticality Scoring Model: Phased Rollout
Scoring your entire asset base at once creates scoring inconsistency and stakeholder disagreement. The fastest path to a reliable model is to pilot on your top 20 most-discussed assets, validate the scoring logic with operations and finance teams, then expand. Facilities that Book a Demo with Oxmaint validate criticality tier logic against historical failure data before applying scores to PM scheduling automation.
- Define scoring weights for each criticality dimension
- Score top 20 assets using maintenance history and ops input
- Validate tier assignments with operations and finance stakeholders
- Link criticality tiers to PM intervals and work order priority in Oxmaint
- Review historical failures against pilot tier assignments for accuracy
- Document scoring rationale for audit and capital planning justification
- Score full production asset register using validated model
- Automate PM scheduling adjustments based on criticality tier
- Set dynamic recalculation triggers when wear trend or failure data changes
- Link Tier 1 and Tier 2 assets to condition monitoring sensor feeds
- Integrate criticality scores into annual capital planning templates
- Review and recalibrate scores quarterly as asset condition evolves
Connecting Criticality Scores to Maintenance Planning and ERP
Criticality scores trapped in a spreadsheet don't change maintenance behavior. Oxmaint connects asset criticality tiers directly to PM scheduling, work order priority, spare parts stock levels, and capital expenditure planning — creating a live maintenance strategy that adjusts as asset condition changes. Reliability leaders who Sign Up Free on Oxmaint eliminate manual tier-to-action translation across every maintenance planning cycle.
Historical work orders, failure records, and condition sensor feeds populate the scoring inputs. Oxmaint aggregates this data per asset to support accurate, evidence-based criticality scoring.
Each asset is scored across production impact, recovery cost, line dependency, wear trend, and lifecycle cost. Tier assignments update dynamically when condition data changes beyond threshold.
Criticality tiers drive PM interval logic and work order priority weights in Oxmaint. Tier 1 assets receive tightened intervals and top-priority dispatch automatically — no manual override required.
Criticality scores feed asset roadmap planning and link to SAP or ERP capital budgeting modules. Planner decisions on replacement timing are backed by scored risk data, not gut instinct.
Oxmaint makes it easy to score, tier, and act on asset criticality data. Connect your asset register, set scoring logic, and automate maintenance prioritization across your production floor.
Asset Criticality Scoring for Production Equipment — Common Questions
Asset criticality scoring ranks equipment by its potential to disrupt production, incur high recovery costs, or create safety and quality risks. It ensures maintenance resources and capital budgets flow to the assets that matter most — not just the ones that failed most recently.
Scores should be reviewed quarterly and recalculated automatically whenever condition data, failure frequency, or production line configuration changes significantly. Oxmaint triggers score recalculation based on defined threshold events.
Yes. Tier 1 and Tier 2 asset scores provide documented, evidence-based justification for capital replacement requests. Finance teams can see the scoring rationale — production impact, lifecycle cost, wear trend — rather than relying on verbal arguments from maintenance leaders.
Yes. Oxmaint allows scoring dimension weights to be configured per facility or asset class. A food and beverage plant may weight compliance and contamination risk higher; a metal fabrication plant may prioritize throughput impact and recovery cost differently.
Criticality tiers directly drive PM interval logic in Oxmaint. Tier 1 assets receive tightened intervals and condition monitoring triggers; Tier 4–5 assets can be extended or moved to run-to-failure — optimizing total maintenance spend without increasing risk exposure.
Start with your top 20 highest-frequency failure assets and score them manually across the five dimensions using maintenance history and operations input. Book a Demo with Oxmaint to see how to load and automate the model from your first 20 pilot assets forward.
Oxmaint connects asset criticality tiers to PM scheduling, work order priority, and capital planning workflows. Score your assets, automate your maintenance strategy, and protect production uptime.