MTBF, MTTR, and OEE are the three reliability KPIs that sort a plant running at 60% capacity from one operating at world-class 85% a 25-point gap that Seiichi Nakajima's original TPM benchmarks (90% Availability × 95% Performance × 99.9% Quality) proved was recoverable in existing equipment without a single capital purchase. Yet most plants track these metrics in spreadsheets that are two weeks stale, calculate them inconsistently across sites, and never expose the causal chain between them: low MTBF drives up MTTR, and poor MTTR depresses OEE. Integrated CMMS programs typically deliver 10–15% OEE improvement in the first few months just by making the three numbers live and visible to the right people at the right time. Book a Demo to see OxMaint's live MTBF / MTTR / OEE dashboard on real work order data — no manual entry, no lag.
MTBF, MTTR & OEE: Reliability KPIs Guide 2026
MTBF, MTTR, OEE — how to measure them right and improve each with AI-native RCM. Live KPI dashboards from OxMaint, calculated automatically as work orders close.
The Live KPI Dashboard — What Good Actually Looks Like
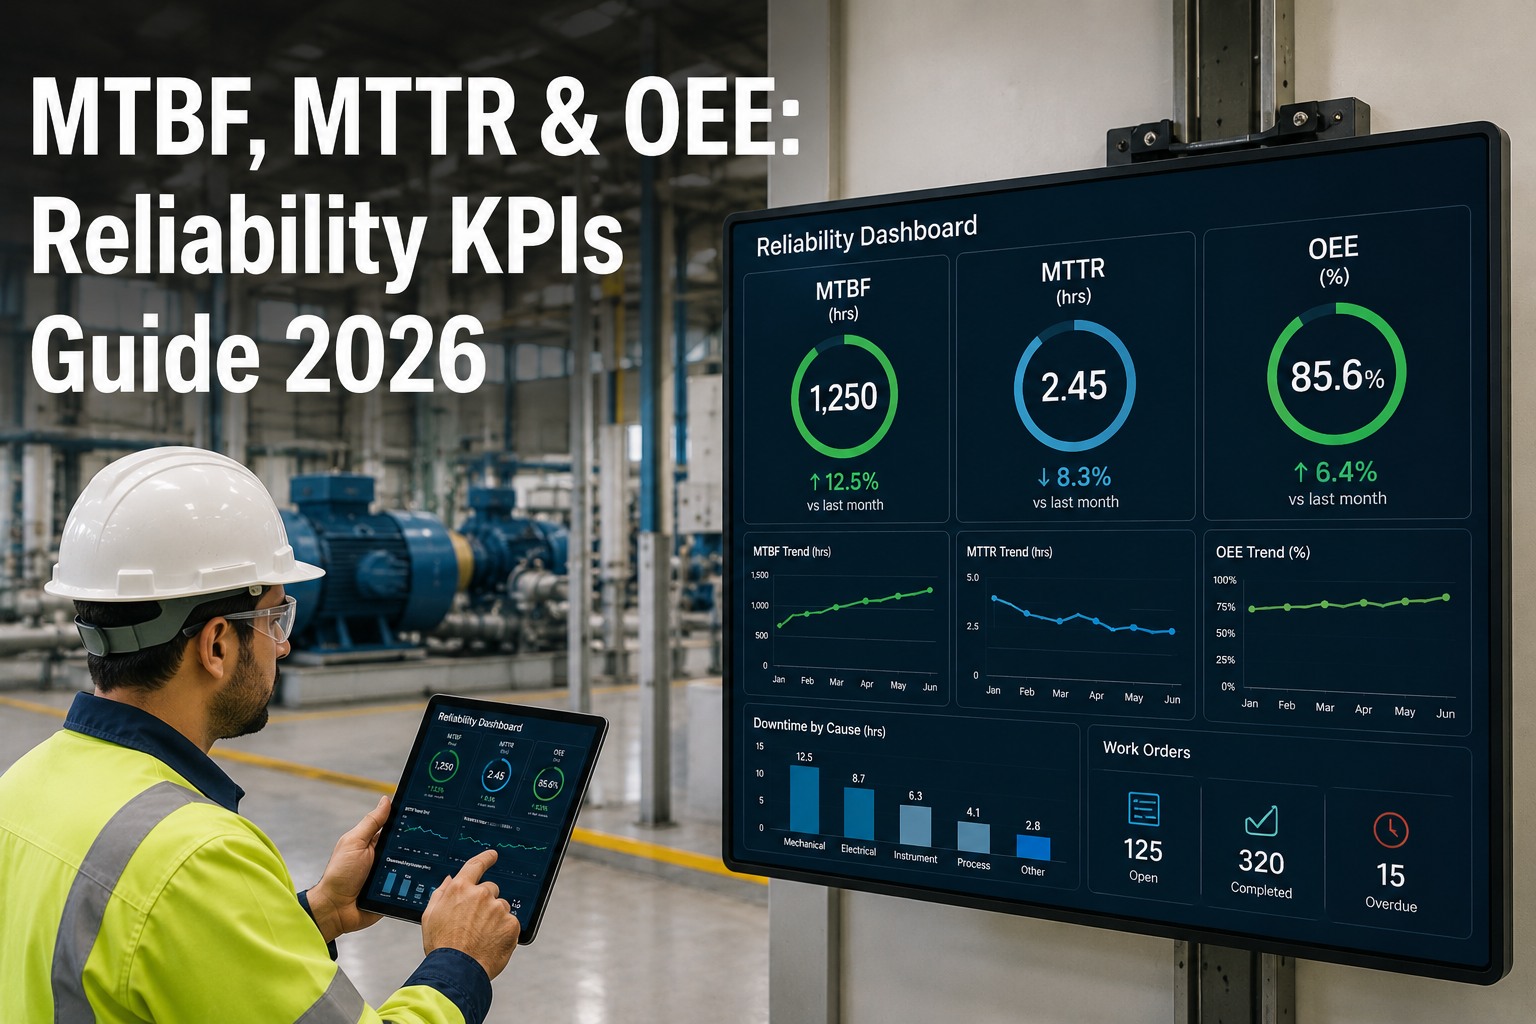
The most useful reliability report ever written fits on one screen. Three KPIs. Current vs target. Trend arrow. That's what a plant manager, reliability engineer, and shift supervisor all need to make a decision before the next meeting. Below is the OxMaint dashboard shape — populated live from work orders, no manual entry. Start a free OxMaint workspace and see your first MTBF and MTTR numbers within your first week of closed work orders — the free plan includes live KPI dashboards, PM scheduling, and asset hierarchy from day one.
The OEE Multiplication — Why 85% Is Harder Than It Looks
OEE isn't three numbers added — it's three numbers multiplied. Which means every component below world-class drags the total geometrically, not linearly. To hit 85% OEE, every one of Availability, Performance, and Quality must be near-perfect simultaneously. Miss one, miss the number. Book a live demo to see the OEE breakdown decomposed against your actual production data — an OxMaint reliability engineer walks the six-big-losses attribution live during the call.
How to Calculate Each — With Working Examples
Consistency in how MTBF, MTTR, and OEE are calculated is more important than the sophistication of the formula. A team using two different denominators for MTBF across two sites can't compare its own numbers. Below is the working formula and a live example for each. Sign up free and every one of these formulas runs automatically against your closed work orders — no spreadsheet, no month-end reconciliation.
Two Weeks Stale Is the Same as Not Tracking.
Reliability KPIs that arrive in a monthly spreadsheet cannot change the shift they measure. OxMaint calculates MTBF, MTTR, and OEE live from every closed work order — so the person who can act on the number sees it before the next production run.
Where Your OEE Actually Sits — The Benchmark Ladder
Before setting an improvement target, know which rung of the ladder you're on. The band you're in determines whether the next quarter's focus is quick-cure visibility (below 40%), targeted PM refactoring (40–60%), condition monitoring rollout (60–75%), or precision TPM discipline (above 75%). Book a working session to benchmark your fleet against this ladder — an OxMaint reliability engineer walks the diagnostic against your existing MTBF/MTTR data live.
Improving Each KPI — What Actually Moves the Number
MTBF, MTTR, and OEE each respond to different levers. Trying to improve OEE without first knowing which of A, P, or Q is dragging is guesswork. Below are the highest-yield actions for each KPI in order of typical impact. Start free and OxMaint automatically shows which lever your data says will move the needle fastest — no manual analysis required.
We were reporting OEE monthly from a spreadsheet that took two people three days to compile — and by the time it landed on the leadership deck, the number was three weeks stale and nobody could act on it. Moving KPIs into OxMaint changed the meeting. We now walk into Monday standup with the previous shift's MTBF, MTTR, and OEE live on the wall. Line 3 has moved from 68% to 79% OEE in eight months. The number didn't change first — the visibility did. Then the number moved.
Frequently Asked Questions
Take Your KPIs Off the Spreadsheet and Onto the Wall.
OxMaint calculates MTBF, MTTR, and OEE live from every closed work order — segmented by asset, shift, and site, with historical trend and drill-down one click away. The person who can act on the number sees it before the next production run.




-for-manufacturing-plants-a-2026-guide.png)


