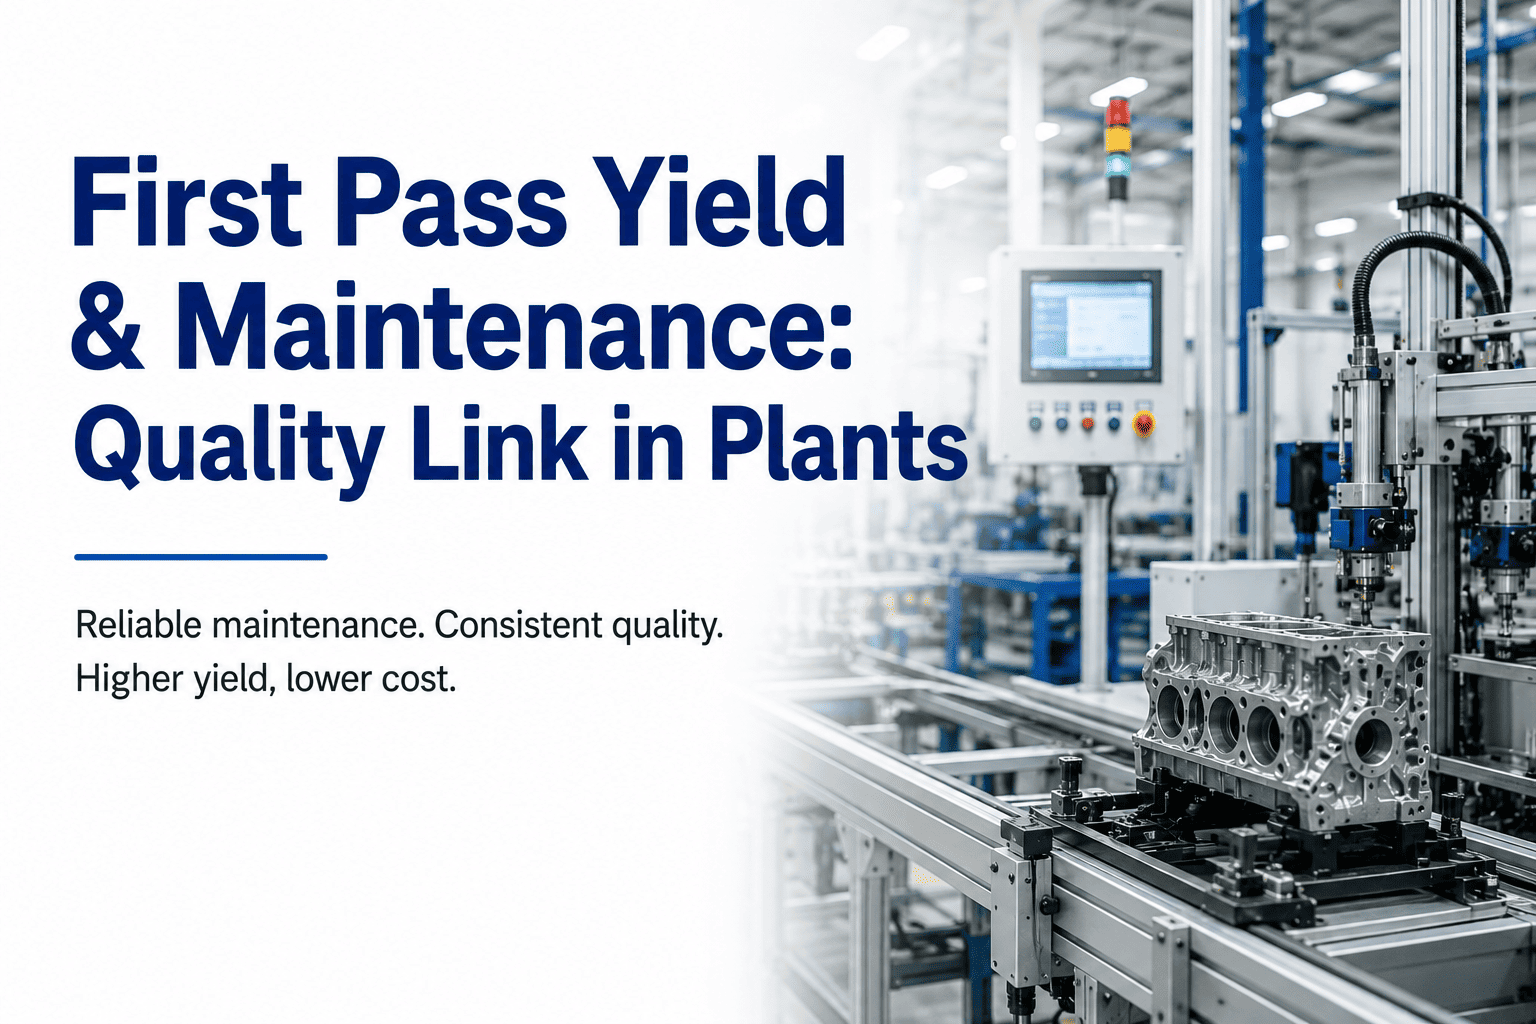
First Pass Yield (FPY) is the single most honest number in your quality programme — the percentage of units that complete a production process correctly the first time, without rework, repair, or scrap. At the industry average of 85–88% FPY, a plant running 10,000 units daily is silently producing 1,200–1,500 defective units every shift: consuming machine time twice, burning labour twice, and absorbing material cost once while delivering zero margin on the rework run. OxMaint's AI quality analytics module identifies the specific process parameters, machine conditions, and operator patterns that predict FPY degradation before defects reach inspection — so your quality improvement actions target root cause, not symptoms. The manufacturers consistently operating above 95% FPY are not running better raw material — they are measuring differently, reacting faster, and using predictive quality systems that surface the signal inside the noise before the scrap bin fills up.
First Pass Yield Improvement: Manufacturing Strategies That Actually Move the Number
Industry benchmarks, root cause frameworks, and the AI-driven measurement approach that separates plants achieving 95%+ FPY from those trapped below 88% — with rework costs compounding silently every shift.
What First Pass Yield Actually Measures — and Why Most Plants Calculate It Wrong
FPY is deceptively simple to define and surprisingly easy to miscalculate. The most common error: counting reworked units that passed final inspection as "first pass." If a unit was touched twice before it cleared quality control, it is not a first-pass unit — regardless of whether it eventually passed. Plants that count rework-then-pass as FPY overstate their yield by 8–15% and underestimate their cost of poor quality by a corresponding margin.
The 5 Root Causes Responsible for 80% of FPY Loss in Manufacturing
Pareto analysis across manufacturing quality datasets consistently identifies five root cause categories that account for approximately 80% of FPY failures. Each requires a different measurement approach and a different corrective action — which is why generic "improve quality" programmes without root cause specificity deliver marginal results.
Temperature, pressure, speed, and feed rate drifting outside specification windows — often by amounts too small to trigger alarms but large enough to generate defects. Accounts for 28–35% of FPY loss. Detectable only through continuous parameter monitoring correlated to inspection outcomes, not through periodic manual checks.
Raw material and component quality variation between supplier batches, within-batch variation, and storage-condition degradation that changes material properties at the machine interface. Accounts for 18–24% of FPY failures — often misattributed to process equipment because the correlation to material lot is never measured.
Gradual degradation in cutting tools, moulds, dies, and fixtures that progressively shifts part dimensions and surface quality outside tolerance. The FPY impact is not sudden — it is a slow decline that accelerates near end-of-tool-life. Without FPY trending per tool age/cycle count, the degradation is invisible until the scrap rate spikes.
Inconsistent procedure execution across operators, shifts, and skill levels — particularly at manual assembly, loading, and setup operations. A process with 94% FPY on day shift and 81% FPY on night shift has an operator method problem, not a machine problem. Shift-stratified FPY data makes this pattern immediately visible.
Vibration, alignment, bearing wear, and calibration drift that degrade process output quality before triggering any maintenance alarm. Machine condition indicators — vibration signature, thermal profile, acoustic emission — often begin correlating to FPY decline 6–12 weeks before the equipment fails or triggers a manual inspection. Predictive quality monitoring captures this window.
FPY Benchmarks by Manufacturing Sector
FPY benchmarks vary significantly by process complexity, tolerance tightness, and automation level. Comparing your FPY against cross-industry averages misrepresents your true performance position. The benchmarks below reflect verified industry data for each sector — a 91% FPY in automotive stamping is top-quartile; 91% in food packaging is below average.
| Manufacturing Sector | Bottom Quartile | Industry Average | Top Quartile | World-Class |
|---|---|---|---|---|
| Automotive Stamping & Forming | <82% | 86–90% | 91–94% | >95% |
| Electronics PCB Assembly | <88% | 91–94% | 95–97% | >98% |
| Precision Machining / CNC | <80% | 84–88% | 89–93% | >95% |
| Plastic Injection Moulding | <85% | 88–92% | 93–96% | >97% |
| Food & Beverage Processing | <92% | 93–96% | 97–98% | >99% |
| Pharmaceutical Solid Dosage | <90% | 92–95% | 96–98% | >99% |
| Metal Fabrication / Welding | <78% | 82–87% | 88–92% | >94% |
| Semiconductor Wafer Fabrication | <70% | 75–82% | 83–90% | >92% |
See Where Your FPY Sits Against Verified Industry Benchmarks
OxMaint calculates your true FPY — per machine, per shift, per material lot — and positions your plant against sector-specific benchmarks automatically. No spreadsheets. No manual calculation. No aggregation that hides your worst-performing stations.
The AI-Driven FPY Improvement Framework: From Measurement to Sustained Gain
Most FPY improvement projects stall at the measurement phase — because they surface the number without surfacing the cause. The framework below shows the progression from basic FPY tracking to AI-driven predictive quality control, with the specific capability unlocked at each stage and the realistic FPY gain achievable.
Establish true FPY (excluding rework) per station, per shift, and per machine. Implement RTY calculation across all production stages. Most plants discover their actual FPY is 6–10 points lower than previously reported once rework is correctly excluded.
Categorise every defect by type, location, machine, operator, and material lot. Run Pareto analysis to identify the 20% of defect types causing 80% of yield loss. This step converts "we have a quality problem" into "Defect Type 3 at Station 4, specifically on material Lot B during Night Shift, accounts for 43% of our total FPY loss."
Correlate defect occurrence with real-time process parameter data — temperature, pressure, speed, humidity, tool age, cycle count. Statistical process control (SPC) and correlation analysis identify the specific parameter windows that predict defects before they occur, enabling process adjustment within the production run rather than post-inspection correction.
Machine learning models trained on historical defect-parameter correlations generate real-time alerts when process signatures indicate elevated defect probability — before defects occur. The system identifies the combination of conditions (not just individual out-of-spec parameters) that precedes quality degradation, enabling pre-emptive process correction with typical lead times of 15–40 minutes before defects would appear at inspection.
Continuous feedback loop between inspection outcomes and process parameter setpoints — the AI model updates control recommendations in response to observed quality trends, material variation, and machine condition changes. Plants at this stage achieve FPY stability rather than FPY improvement: variance is reduced, not just the mean shifted upward. This is the operating mode of plants consistently above 96% FPY.
Financial Value of FPY Improvement: Converting Quality Points to Profit
Quality teams that cannot quantify the financial value of FPY improvement in terms leadership acts on lose budget decisions to capital projects with clearer ROI stories. The calculation framework below shows how to convert FPY improvement points into revenue and cost figures your finance team can validate.
The reason most FPY improvement programmes plateau at 90–91% and never break through is that the measurement system and the improvement system are disconnected. You have quality engineers generating weekly defect reports from inspection data, and process engineers receiving those reports three days later — by which time the process conditions that caused the defects have changed twice. The feedback loop is too slow to enable real improvement. The plants I have seen sustain 95%+ FPY over multi-year periods all have one thing in common: their defect data and their process parameter data are in the same system, correlating in real time, and generating alerts that reach the right person within the production window where intervention is still possible. That is not a quality philosophy — it is an engineering infrastructure decision. Everything else — Six Sigma projects, operator training, incoming inspection — sits on top of that foundation, and without it, they deliver incremental gains that regress within six months.
Frequently Asked Questions
FPY measures the percentage of units that pass quality inspection the first time without rework or repair. OEE measures total equipment productivity including availability, performance speed, and quality rate. The Quality component of OEE is directly related to FPY — a 94% OEE Quality rate is equivalent to a 94% FPY at that station. However, FPY is measured per unit and per process step, while OEE Quality is measured per machine cycle — making FPY a more granular tool for defect root cause analysis. OxMaint tracks both FPY and OEE simultaneously, linking quality losses to the specific machine conditions and process parameters that caused them.
Plants implementing accurate measurement (true FPY, not rework-inclusive) and Pareto-based defect analysis typically achieve 2–4 percentage point FPY gains within the first 60–90 days — simply by identifying and addressing the top three defect contributors that are usually visible once the data is properly structured. Gains beyond that require process parameter correlation analysis and take 3–6 months. Book a demo to see how OxMaint accelerates the measurement-to-improvement cycle.
OxMaint calculates FPY from inspection records, work order data, and production counts — capturing pass/fail outcomes per unit, per station, and per production run without requiring additional data entry from operators. Integration with existing vision systems, CMM outputs, and SCADA historians is supported for plants with automated inspection infrastructure, but is not a prerequisite. Start your free trial to begin FPY tracking from your existing quality records.
Yes — and the most effective justification is financial rather than methodological. Convert your current FPY gap to peer benchmark into daily rework cost, annual scrap material cost, and machine capacity consumed by rework operations. A plant at 87% FPY with a peer benchmark of 93% has a quantifiable cost gap that finance and operations leadership can act on directly, without requiring Six Sigma infrastructure. Book a demo to see OxMaint's FPY benchmark gap financial report format.
Machine condition degradation — bearing wear, spindle runout, alignment drift — is a direct driver of FPY decline, and it follows a predictable trajectory that begins 4–8 weeks before the machine triggers a maintenance alarm. Vibration signature changes, thermal drift, and acoustic emission shifts correlate to FPY decline during this window. Predictive maintenance that monitors these indicators and schedules intervention before defect rates rise is one of the highest-ROI FPY improvement levers available. Explore OxMaint's predictive maintenance and quality integration.
Stop Losing Margin to Rework You Can Predict and Prevent
OxMaint identifies the process parameters, machine conditions, and material patterns that predict FPY degradation before defects reach inspection — giving your quality and maintenance teams the lead time to intervene, not just react. Per station. Per shift. Per material lot. Real time.