Most manufacturing plants chase OEE improvement without knowing exactly which losses are eating their numbers — and that is why improvement efforts stall. The Six Big Losses framework, developed as part of Total Productive Maintenance, gives every plant manager and maintenance engineer a precise map of where production efficiency disappears: from unplanned breakdowns that stop lines cold to subtle speed reductions that quietly drain output over every shift. This guide breaks down each loss with real-world examples, measurable benchmarks, and the elimination strategies that move your OEE from average to world-class.
The Six Big Losses — Mapped to OEE
Availability Losses
Stops that reduce Run Time
Loss 1: Breakdowns
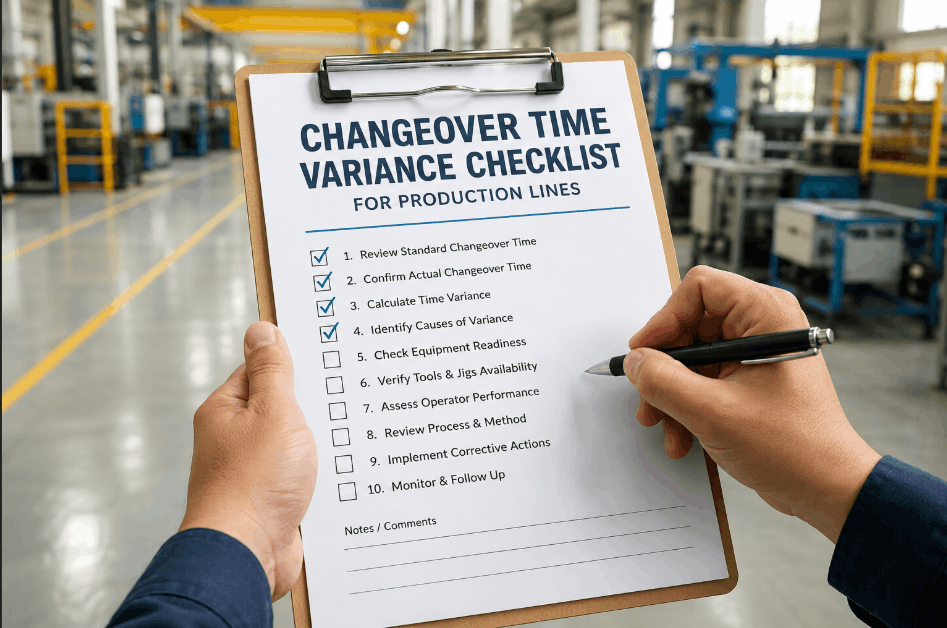
Loss 2: Setup & Changeover
Performance Losses
Slowdowns during Run Time
Loss 3: Minor Stoppages
Loss 4: Reduced Speed
Quality Losses
Defects during Run Time
Loss 5: Production Defects
Loss 6: Startup Rejects
Availability
×
Performance
×
Quality
=
OEE Score
Loss 1: Unplanned Breakdowns
Availability Loss
Average OEE Impact
Highest — up to 15 OEE points
42%
of all unplanned downtime caused by equipment failure
What It Is
Any unscheduled stop where a machine fails to produce during planned production time — motor burnouts, bearing failures, conveyor jams, hydraulic leaks, and electrical faults. Breakdown events are the most visible and most expensive single loss category because they halt output entirely, trigger emergency maintenance at premium cost, and frequently cause secondary damage to adjacent equipment.
Common Causes
Elimination Strategy
Deploy vibration analysis, thermal monitoring, and AI-based anomaly detection to catch degradation signatures 2–6 weeks before failure. Predictive maintenance programs reduce breakdown frequency by 30–50% in 12 months while cutting repair costs by 25–30% by enabling planned interventions instead of emergency callouts.
Loss 2: Setup and Changeover Time
Availability Loss
Average OEE Impact
Moderate — 3 to 8 OEE points
30–40%
of plants report changeovers as their top availability loss
What It Is
All time lost between the last good part of one production run and the first good part of the next — including tooling changes, fixture swaps, cleaning, adjustment, and warm-up. In high-mix, low-volume manufacturing environments, changeover time can represent 20–30% of total planned production time, making it the dominant Availability loss ahead of even breakdowns.
Common Causes
Elimination Strategy
Apply SMED (Single-Minute Exchange of Die) methodology to separate internal tasks (machine stopped) from external tasks (done while running). Converting 40% of internal work to external typically cuts changeover time by 50%. Standardized setup sheets, pre-staged tooling carts, and digital work instructions eliminate variation between operators.
Loss 3: Minor Stoppages and Idling
Performance Loss
Average OEE Impact
Significant — 4 to 10 OEE points
80%
of minor stoppages go unrecorded in manual tracking systems
What It Is
Brief interruptions under 5–10 minutes where equipment stops or idles without a formal breakdown being logged — jammed sensors, material misfeeds, part accumulation on conveyors, and operator micro-adjustments. Individually insignificant, these events compound into massive performance losses across a shift. A machine that stops for 2 minutes every 20 minutes is running at only 90% performance even if zero breakdowns are recorded.
Common Causes
Elimination Strategy
Real-time OEE monitoring platforms automatically detect and log micro-stops that manual systems miss entirely. Once captured, Pareto analysis of stop reasons reveals the 2–3 root causes responsible for 80% of events. Targeted engineering fixes — sensor calibration, chute redesign, guide rail adjustments — then eliminate the top causes permanently.
Loss 4: Reduced Speed
Performance Loss
Average OEE Impact
Often underestimated — 3 to 8 OEE points
60%
of plants run equipment below nameplate speed without realizing the full OEE cost
What It Is
Equipment running below its designed or ideal cycle rate — whether due to component wear, operator conservative settings, upstream bottlenecks, or quality concerns. Reduced speed is the most underreported Performance loss because the machine is technically running and producing; the loss is invisible without comparing actual throughput to the nameplate ideal rate. A press running at 85% of its rated speed appears healthy but is silently losing 15% of potential daily output.
Common Causes
Elimination Strategy
Audit ideal cycle rates for each asset — many plants use outdated benchmarks set 5–10 years ago that no longer reflect equipment capability. Address root causes of speed reduction: worn drives, misaligned components, and tooling condition. Implement condition-based speed monitoring that alerts maintenance when actual speed deviates more than 5% from the established ideal.
Track All Six Losses in Real Time — Without Manual Data Entry
Oxmaint automatically captures every loss event, categorizes it by type, and links it directly to a work order — giving your maintenance team the data to eliminate losses before they become habits.
Loss 5: Production Defects and Scrap
Quality Loss
Average OEE Impact
Variable — 1 to 6 OEE points
20–35%
scrap reduction achievable in machining with predictive tool management
What It Is
Parts produced during steady-state operation that fail dimensional, visual, or functional quality inspection — whether scrapped or sent for rework. Every defective part consumed machine time, material, and energy without delivering sellable output. In precision manufacturing, scrap rates of even 1–2% compound into significant cost when running high-volume production across multiple lines.
Common Causes
Elimination Strategy
Statistical Process Control (SPC) monitors key process parameters in real time against control limits, detecting process drift before defective parts are produced. Combining SPC with predictive tool change scheduling — based on actual cutting data rather than fixed intervals — eliminates the two largest drivers of production defects simultaneously.
Loss 6: Startup Rejects
Quality Loss
Average OEE Impact
Contained — 1 to 3 OEE points
1–3 hrs
typical startup reject window in process manufacturing after every changeover
What It Is
Off-spec output produced during the warm-up period after a startup, shift change, or changeover — before the process stabilizes within acceptable quality parameters. While individual startup reject windows may be short, their cumulative impact across multiple daily changeovers or shift starts is material. Process manufacturers with frequent product switches are disproportionately affected by this loss category.
Common Causes
Elimination Strategy
Standardized startup procedures with defined parameter hold points reduce reject windows by 40–60%. Digital work instructions that guide operators step-by-step — with mandatory confirmation gates before production starts — eliminate operator-to-operator variation that extends the reject window. Log startup reject quantities per event to build a Pareto of the highest-impact changeover types.
Six Big Losses: At-a-Glance Comparison
| Loss | Category | Typical OEE Hit | Detection Method | Primary Fix |
|---|---|---|---|---|
| 1. Breakdowns | Availability | Up to 15 pts | Condition monitoring + alerts | Predictive maintenance program |
| 2. Setup & Changeover | Availability | 3–8 pts | Shift log analysis | SMED methodology |
| 3. Minor Stoppages | Performance | 4–10 pts | Real-time OEE platform | Pareto + engineering fix |
| 4. Reduced Speed | Performance | 3–8 pts | Cycle time benchmarking | Root cause repair + rate audit |
| 5. Production Defects | Quality | 1–6 pts | SPC control charts | Process control + tool mgmt |
| 6. Startup Rejects | Quality | 1–3 pts | Startup quality logging | Standardized startup procedures |
How to Prioritize Which Loss to Attack First
Use this decision framework to direct your improvement effort where it delivers the fastest and largest OEE recovery.
Step 1
Measure Your Baseline OEE by Component
Calculate current Availability, Performance, and Quality scores separately. Whichever component scores lowest is your highest-leverage improvement zone. Do not address all six losses simultaneously — diluted focus produces diluted results.
Step 2
Capture and Quantify Each Loss Type
Deploy real-time monitoring on your highest-risk assets so every loss event is logged with timestamp, duration, and category. Manual tracking misses minor stoppages entirely — you cannot Pareto-analyze data you never collected. This step alone frequently reveals that Performance losses are far larger than reported.
Step 3
Pareto Your Top Loss Contributors
Sort loss events by total time impact over a 4-week rolling window. In most plants, 2–3 loss categories account for 70–80% of total OEE loss. Focus your improvement project entirely on those top contributors — fixing the 20th biggest loss while ignoring the 1st is a common and costly mistake.
Step 4
Apply Targeted Elimination and Measure Impact
Execute one targeted improvement project per loss type — predictive maintenance for breakdowns, SMED for changeovers, engineering fixes for minor stops. Measure OEE impact after 4–8 weeks, validate the gain, then move to the next largest loss. This structured cycle consistently produces 3–5 OEE point gains per improvement cycle.
Turn Loss Data Into Maintenance Work Orders Automatically
Oxmaint connects your OEE loss tracking directly to maintenance workflows — every detected loss triggers the right work order, routed to the right technician, with the right asset history attached. No manual handoffs, no missed follow-through.
Frequently Asked Questions About the Six Big Losses
Where did the Six Big Losses framework originate?
The Six Big Losses were defined by Seiichi Nakajima as part of the Total Productive Maintenance (TPM) methodology, originally developed in Japan in the 1970s and widely adopted globally through the 1980s and 1990s. They remain the standard loss categorization framework used in lean manufacturing, TPM programs, and modern OEE tracking platforms because they map directly to the three components of OEE — Availability, Performance, and Quality — making loss attribution and improvement targeting straightforward.
Is it possible to reach 100% OEE if all six losses are eliminated?
Theoretically yes — 100% OEE means running at full speed, producing only good parts, with zero unplanned stops during planned production time. In practice, 85% is considered world-class because some level of loss is structurally unavoidable in any real production environment. Rather than chasing 100%, the goal is identifying and eliminating the largest loss contributors to move from your current score toward the 85%+ benchmark. Book a consultation to map your specific loss profile and realistic improvement trajectory.
How do minor stoppages differ from unplanned breakdowns in OEE tracking?
The distinction is duration: minor stoppages are typically under 5–10 minutes and do not require a formal maintenance intervention — the operator clears them and restarts. Breakdowns require a maintenance work order to restore function. Both are Availability or Performance losses, but they require completely different tracking methods and solutions. Real-time OEE platforms automatically categorize each stop by duration, preventing the common mistake of under-reporting minor stops that manually get rounded to zero.
Can the Six Big Losses framework apply to process manufacturing, not just discrete?
Yes — the Six Big Losses apply to all manufacturing environments, though the relative weight of each loss shifts. Process manufacturing (chemical, food, pharmaceutical) tends to have larger Quality and Setup losses due to long changeover cleaning cycles and significant startup reject windows. Discrete manufacturing typically shows larger Availability losses from breakdowns and tooling-related stoppages. Oxmaint's loss tracking is configurable to match the loss profile of your specific production environment.
How long does it take to see measurable OEE improvement after starting Six Big Losses tracking?
Most plants see their first measurable OEE gain within 60–90 days of deploying structured loss tracking — primarily because capturing minor stoppages and reduced speed for the first time exposes Performance losses that were previously invisible. Sustained OEE gains of 5–15 points over 12 months are typical for plants that combine accurate loss measurement with structured improvement projects targeting their top contributors. Start measuring your losses today to build the baseline data that makes every improvement decision defensible.
Stop Losing OEE Points You Don't Even Know You're Losing
Oxmaint gives your team real-time Six Big Losses tracking, automatic work order creation on detected loss events, and the asset history to eliminate root causes — not just symptoms. Built for manufacturing maintenance teams who are ready to move from reactive to strategic.