Overall Equipment Effectiveness (OEE) is the most powerful KPI in manufacturing — yet most plants either measure it inconsistently or fail to act on what it reveals. A disciplined OEE improvement program surfaces hidden production losses, aligns maintenance and operations teams around shared targets, and drives measurable throughput gains without capital investment. This guide covers how to use OEE to systematically identify losses, prioritize improvement projects, and set realistic targets across availability, performance, and quality in 2026. Whether you're introducing OEE for the first time or sharpening an existing measurement program, Sign Up Free to connect your assets and start tracking OEE from day one. For a walkthrough of how OxMaint's analytics dashboard automates OEE reporting, Book a Demo with our team.
Start Measuring OEE the Right Way
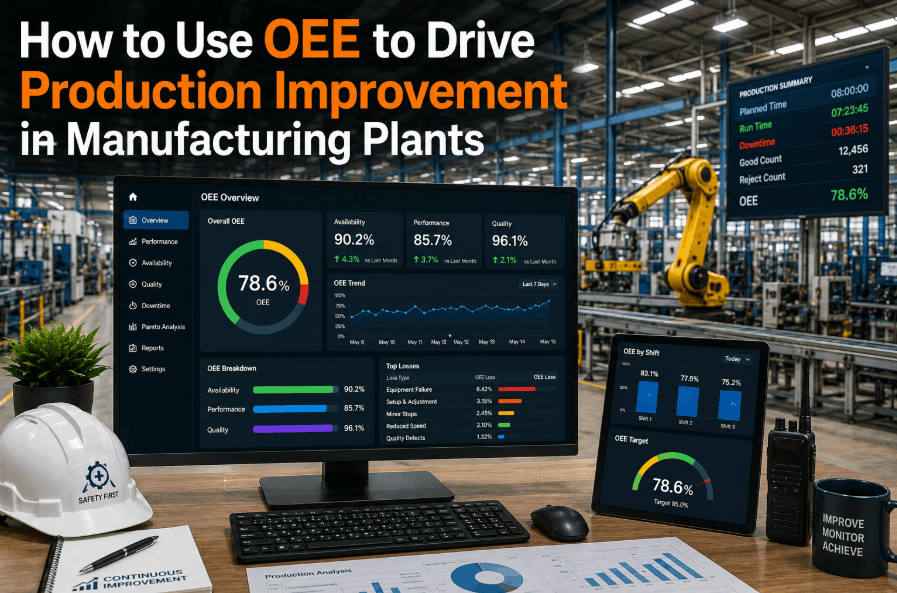
OxMaint's OEE analytics module connects to your asset data, calculates availability, performance, and quality in real time, and surfaces the losses costing you production hours every shift.
What Is OEE and Why Does It Matter for Manufacturing Plants?
OEE quantifies how effectively a manufacturing asset uses its scheduled production time. It multiplies three factors — Availability, Performance, and Quality — to produce a single percentage that reflects true productive output versus theoretical maximum. A world-class OEE of 85% means 15% of scheduled time is lost to downtime, speed losses, or defects. Most plants operate between 40–60% OEE, meaning 40–60% of their capacity is being consumed by preventable losses. Sign Up Free to begin capturing shift-level OEE data automatically from your equipment. OEE is not just a measurement — it is a structured diagnostic framework for identifying exactly where production time disappears.
The Six Big Losses — OEE Loss Classification Framework
The Six Big Losses framework, derived from Total Productive Maintenance (TPM), maps every form of production loss to one of three OEE categories. Classifying losses this way makes improvement priorities visible and allows teams to track reduction progress over time. Book a Demo to see how OxMaint automatically categorizes work orders and downtime events into the Six Big Losses framework for your assets.
| OEE Category | Loss Type | Example | Primary Driver | Improvement Lever |
|---|---|---|---|---|
| Availability | Unplanned Downtime | Equipment breakdown mid-shift | Reactive maintenance culture | Predictive maintenance, RCM |
| Availability | Planned Downtime | Changeovers, PM shutdowns exceeding target time | Inefficient changeover procedures | SMED, PM scheduling optimization |
| Performance | Minor Stops | Jams, sensor faults, material feed interruptions | Equipment condition, operator response time | Autonomous maintenance, 5S |
| Performance | Speed Loss | Running below nameplate rate to avoid defects | Tooling wear, process instability | CBM on tooling, process capability |
| Quality | Startup Rejects | First-off parts out of spec during startup | Process setup inconsistency | Standardized work, setup verification |
| Quality | In-Process Defects | Scrap and rework during normal production | Process drift, material variation | SPC, condition-based process control |
How to Use OEE Data to Drive Production Improvement
Before targeting improvement, measure current OEE at asset and shift level for a minimum of 4 weeks. Baseline data reveals which assets and shifts drive the largest losses and removes assumptions from prioritization decisions.
Identify which of availability, performance, or quality is the primary loss driver for each asset. Assets with low availability require maintenance strategy changes. Assets with low performance require process or speed investigation. Assets with low quality require root cause analysis at the process level.
Not all low-OEE assets are equal. Rank improvement projects by the production volume impact of each OEE loss — a bottleneck asset at 55% OEE has more improvement value than a non-bottleneck at 70%. Focus resources on constraint assets first.
Classify every downtime event and production loss by loss type. Pareto analysis of loss categories over 90 days reveals whether unplanned downtime, speed loss, or quality defects dominate the improvement agenda — and determines which team owns the corrective action.
Set 90-day, 6-month, and 12-month OEE targets for each priority asset. Realistic first-year improvement from a structured program is 8–15 OEE percentage points on targeted assets. Stage targets to maintain team engagement and track momentum shift by shift. Book a Demo to see how OxMaint's shift-level dashboard makes OEE targets visible to operators and supervisors in real time.
OEE improvement requires daily accountability. Review prior-shift OEE, loss categories, and open corrective actions in a structured 10-minute meeting. Teams that review OEE daily sustain improvement momentum; teams that review monthly regress. Sign Up Free and access mobile-ready OEE shift reports for your production floor immediately.
OEE Benchmark Targets — 2026 Manufacturing Industry Standards
OEE Improvement Strategies by Loss Category
How OxMaint Automates OEE Tracking and Improvement
OEE measurement is only as good as the data infrastructure behind it. Manual OEE tracking in spreadsheets is slow, inaccurate, and never leads to action. OxMaint provides manufacturing teams with a CMMS platform that captures downtime events, loss categories, and production data in real time — automatically calculating OEE at asset, line, and plant level. Reliability engineers and production managers Sign Up Free to connect their first production asset and begin generating shift-level OEE reports immediately. Book a Demo to see OxMaint's live OEE dashboard in action.
OEE Measurement Maturity — Reactive vs Structured Program
Turn OEE Data Into Production Improvements with OxMaint
OxMaint gives manufacturing teams the real-time OEE analytics, Six Big Losses reporting, and automated work order generation needed to move from measuring losses to eliminating them shift by shift.
Frequently Asked Questions — OEE in Manufacturing
Ready to Drive World-Class OEE Performance?
OxMaint connects your production and maintenance data into a single OEE analytics platform — giving every team the visibility and tools to eliminate losses shift by shift.