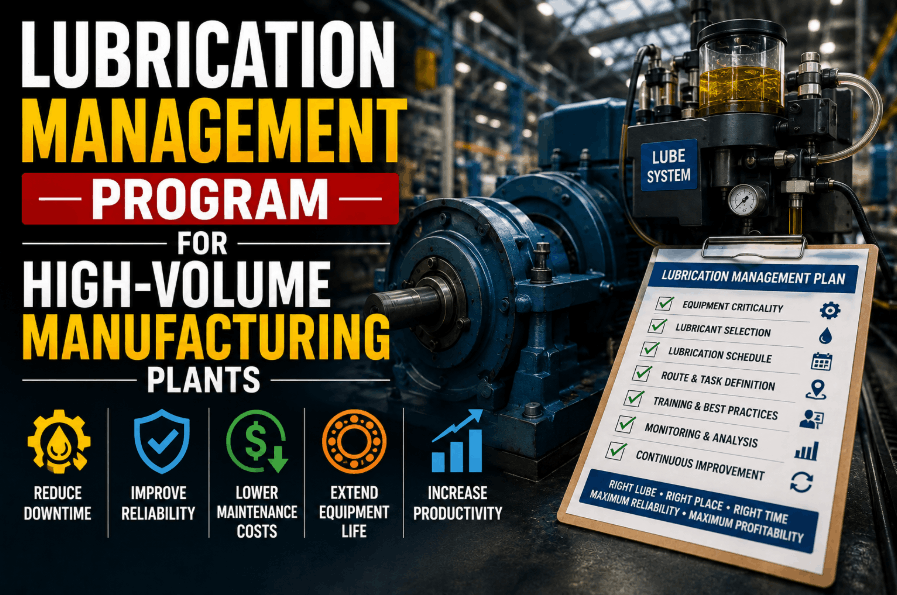
High-volume manufacturing plants waste 8–15% of rotating equipment lifespan and consume 15–25% excess energy due to inadequate or inconsistent lubrication management. Friction losses from poor lubrication reduce bearing life from 50,000 hours to 8,000–12,000 hours while adding 5–12% to motor energy consumption. Structured lubrication programs aren't just maintenance checklists—they're the direct path to extended asset life, predictable maintenance costs, and measurable energy savings. Sign Up Free with Oxmaint to centralize lubrication scheduling, track oil condition monitoring, and automate compliance across high-volume production lines. This guide delivers the framework plant managers, reliability engineers, and maintenance teams need to design evidence-based lubrication programs, eliminate friction losses, measure bearing health, and prove ROI on every gallon of oil and every maintenance hour invested.
How Lubrication Programs Control Equipment Life, Energy Efficiency, and Production Reliability
Lubrication is the most cost-effective preventive maintenance intervention available—a gallon of the correct lubricant costs $8–30, yet its absence costs $5,000–50,000 in premature bearing, gear, and spindle failure. Poor lubrication creates friction losses that increase motor load 5–12%, boosting energy consumption and heat generation. Inadequate or contaminated oil allows bearing wear particles to accumulate, accelerating wear from gradual to exponential. Most critical: bearing failures are almost entirely predictable through condition-based lubrication monitoring. When viscosity remains within 10–15% of design specification, bearing operating temperature stays within limits and wear rates remain predictable. When viscosity drifts beyond ±20% or particle contamination exceeds ISO 18/16/13 cleanliness, bearing life collapses within 500–1,500 operating hours. A structured lubrication program tracking oil age, condition, and consumption patterns detects these drift points weeks before catastrophic failure. Book a Demo to see how Oxmaint tracks lubrication compliance, oil condition trends, and triggers predictive maintenance before viscosity drift accelerates bearing wear.
Lubrication Failure Modes in High-Volume Manufacturing: Root Causes and Prevention
Manufacturing equipment fails due to predictable lubrication deficiencies where preventive scheduling and condition monitoring eliminate 70–85% of friction-related failures. Sign Up Free to build a lubrication calendar that targets the most critical equipment and failure modes first.
Heat and oxidation reduce oil viscosity 15–25% annually in equipment running at ≥100°C. Thin oil fails to support bearing film, accelerating wear 10–20x. Quarterly oil sampling and viscosity trending, combined with cooling system maintenance, prevent catastrophic viscosity-related failures within 500–800 hours.
Dust ingress and wear particle accumulation degrade ISO cleanliness 2–3 grades per 2,000 hours without filtration. Contaminated oil (>ISO 20/18/15) escalates bearing wear 5–15x. Semi-annual particle count testing and quarterly filter replacements maintain cleanliness and predict failures 1,000–2,000 hours early.
Oil starvation from neglected top-ups or leaking seals reduces bearing film thickness, generating heat and friction. Temperature rises 20–40°C above design within 50–200 operating hours. Monthly oil level checks and thermal imaging detect starvation before temperature-induced bearing failure begins.
Mineral oils degrade 10–15% per 1,000 hours at elevated temperature. Aged oil loses viscosity and develops varnish deposits that block cooling passages and reduce heat transfer 20–35%. Condition-based oil changes triggered by viscosity and acid number trending prevent oxidation-induced failures 2,000–3,000 hours before TBN collapse.
Using incorrect viscosity grade, additive package, or oil type (mineral vs. synthetic vs. PAO) causes film failure, incompatibility reactions, and seal degradation. Specification documentation and standardized lubricant inventory prevent misapplication. Synthetic oils extend drain intervals 2–3x over mineral equivalents in high-speed equipment.
Skipped lubrication tasks due to production pressure or missing documentation allow equipment to run dry for hours or days. Bearing temperature spikes 40–80°C within 2–6 hours of starvation. Automated CMMS reminders, condition-triggered alerts, and technician accountability ensure 95%+ compliance with critical lubrication tasks.
Lubrication Management Program Tasks: Frequency, Measurement, and Bearing Life Impact
Evidence-based lubrication programs link task frequency directly to bearing failure prevention and energy consumption reduction. Plant directors implementing generic lubrication checklists miss condition-based optimization that tracks oil TBN, viscosity, and cleanliness to extend drain intervals 2–3x or detect failures 1,000–2,000 hours early. Book a Demo to see how Oxmaint tracks lubrication intervals against condition data and automates oil change orders when testing shows degradation.
| Equipment Type | Lubrication Failure Mode | Preventive Lubrication Task | Base Frequency | Bearing Life Impact |
|---|---|---|---|---|
| Rolling Element Bearings | Viscosity degradation, contamination, starvation | Monthly oil level check, quarterly particle count, semi-annual viscosity testing, condition-based oil changes | Monthly to Quarterly | 5–8x life extension (12,000 to 50,000+ hours) |
| Motor & Spindle Bearings | High-temperature viscosity loss, varnish deposits | Thermal imaging (temperature baseline), quarterly oil analysis, annual bearing replacement or condition-based extension | Monthly Thermal + Quarterly OA | 3–5x life extension, 15–25% energy reduction |
| Gear Boxes | Gear wear particle accumulation, oxidation, foam | Quarterly particle count, semi-annual TBN testing, annual viscosity grade verification, condition-based drain intervals | Quarterly | 6–10 year service life (versus 3–4 years unmonitored) |
| Pump Bearings | Cavitation, wear debris, inadequate flow | Monthly outlet pressure monitoring, quarterly particle count, vibration analysis (semi-annual), lubrication system flush when cleanliness |
Monthly Pressure + Quarterly | 4–6x bearing life, 10–18% pump efficiency recovery |
| Spindle Oil Systems | Oil oxidation at 80–120°C, coolant mixing, coolant emulsion formation | Monthly temperature monitoring, quarterly demulsibility testing, monthly coolant/oil separation checks, condition-based drains | Monthly + Quarterly OA | Prevents coolant-induced spindle failure, extends 2–3x service intervals |
| Lubrication System Delivery | Filter blockage, pump cavitation, line restrictions, nozzle contamination | Monthly filter differential pressure, quarterly system flow rate, annual nozzle inspection, semi-annual inlet strainer cleaning | Monthly | Ensures consistent bearing film, prevents starvation-induced catastrophic failures |
| Hydraulic Systems (Servo) | Water ingress, particulate contamination, viscosity drift | Monthly moisture testing, weekly particle count (servo systems), quarterly acid number, condition-based drains every 1,000–2,000 hrs | Weekly to Monthly | Prevents servo degradation, extends system 3–5x, reduces failure rate 80–90% |
| Compressed Air Bearing Lubrication | Oil carryover causing production contamination, inadequate atomization | Weekly oil level (lung tank), monthly nozzle cleaning, quarterly air-oil separator efficiency check, filter replacement monthly | Weekly to Monthly | Prevents bearing starvation, maintains consistent speed, prevents product contamination |
Building a High-Volume Lubrication Program Using CMMS and Condition-Based Oil Monitoring
Manufacturing plants achieving 5–8x bearing life extension and 15–25% energy savings use centralized CMMS platforms paired with routine oil condition testing and condition-based monitoring to convert lubrication from a "best guess" task into a predictive science. Automated oil sampling schedules, trending of particle counts and viscosity, and predictive alerts when ISO cleanliness or TBN trend toward failure eliminate the guesswork. Sign Up Free and link your first production equipment to lubrication scheduling and oil condition trending.
- Catalog all rotating equipment and standardize lubrication specifications (viscosity grade, type, ISO cleanliness target)
- Document baseline operating conditions (temperature, speed, load) for each equipment family
- Create standardized inventory of approved lubricants to prevent misapplication and simplify procurement
- Import equipment inventory into Oxmaint and assign lubrication tasks (monthly level checks, quarterly oil analysis, semi-annual viscosity testing)
- Configure automated reminders for technicians based on equipment type and criticality
- Set compliance thresholds (e.g., alert if monthly oil level check missed >2 weeks, auto-escalate)
- Conduct baseline oil samples for all critical equipment: ISO cleanliness code, viscosity index, TBN (Total Base Number), particle count trend
- Plot viscosity and cleanliness trends in CMMS to establish health baselines and trigger thresholds
- Configure automated alerts when viscosity drifts >15%, particle count exceeds ISO 19/17/14, or TBN drops below 2.0 mg KOH/g
- Measure bearing temperature and vibration baseline, track monthly trending against lubrication compliance
- Calculate bearing remaining useful life (RUL) using wear particle count and viscosity degradation rate
- Measure energy consumption before and after lubrication interventions (oil changes, bearing replacement) to quantify kWh savings
Lubrication Best Practices: Common Failure Patterns and Quick Wins
Lubrication Management KPIs and Performance Metrics
Manufacturing plants tracking measurable lubrication performance link maintenance discipline directly to bearing life, energy consumption, and equipment reliability. When operations see that 95%+ lubrication compliance correlates with 40,000+ bearing life versus 65% compliance resulting in 8,000–12,000 hour failures, lubrication becomes a strategic asset. Sign Up Free to access lubrication compliance and bearing health KPI dashboards built for manufacturing teams.
Percentage of scheduled lubrication tasks completed on or before due date. Below 85% compliance predicts bearing failure acceleration within 2–4 months. Automated CMMS reminders and technician accountability keep compliance above 90%.
Oil cleanliness code and viscosity grade trending from quarterly samples. Rising particle count or viscosity drift below ±15% design specification triggers predictive oil change. Prevents 500–1,500 hour bearing failure windows.
Actual bearing service hours achieved versus nameplate L10 specification. Lubrication-driven improvement: 8,000–12,000 hours (poor) → 25,000–35,000 hours (good) → 40,000–50,000 hours (world-class). Directly measures maintenance effectiveness.
kWh per unit produced. Friction losses from poor lubrication add 5–12% to baseline. Lubrication discipline + bearing replacement recovers 8–15% energy savings. Direct financial benefit: $5,000–150,000 annually depending on equipment size and runtime.
Cost per bearing failure. Proper lubrication extends life 5–8x, reducing replacement frequency from every 12–18 months to every 4–6 years for critical equipment. Annual savings: $20,000–200,000+ depending on equipment population.
ROI of quarterly oil analysis ($50–100 per test) versus bearing failure cost ($5,000–50,000). Particle count trending detects failures 1,000–2,000 hours early. ROI: 50–100x typical when oil analysis prevents catastrophic failure.


.png)