Manufacturing plants waste 15–35% of production capacity through unplanned equipment downtime, efficiency losses, and poor maintenance visibility. OEE improvement through data-driven maintenance isn't just an operational metric—it's the direct path to measurable capacity gains, cost reduction, and competitive advantage. Sign Up Free with Oxmaint OEE Analytics to track Availability, Performance, and Quality in real-time, linking maintenance actions directly to productivity improvements. This guide delivers the practical framework that plant managers, operations directors, and maintenance teams need to measure OEE accurately, identify the Six Big Losses, implement targeted maintenance strategies, and prove ROI on every intervention.
How Maintenance Data Directly Drives OEE Improvement and Manufacturing Capacity
OEE (Overall Equipment Effectiveness) declines when equipment runs with invisible efficiency losses—unplanned downtime from deferred maintenance, slow cycles from worn bearings and misalignment, and quality defects from inadequate preventive care. When you connect maintenance history, work order completion rates, and condition monitoring to production data, every maintenance action becomes measurable against OEE impact. A bearing replacement improving motor performance by 8% translates directly to 8% less Performance loss. Catching a failing drive 72 hours before breakdown converts emergency downtime into scheduled maintenance, recovering 15–30% Availability. Proper lubrication schedules eliminate friction losses that drag down cycle time by 3–7%. World-class OEE of 85% (90% Availability × 95% Performance × 99% Quality) is only achievable when maintenance operates as a direct driver of production metrics, not a cost center. Book a Demo to see how Oxmaint's OEE + CMMS integration automatically triggers maintenance when productivity drops, then tracks the OEE recovery post-repair.
The Six Big Losses: Maintenance Root Causes That Destroy OEE
Manufacturing OEE losses concentrate in predictable failure modes where preventive and predictive maintenance delivers the highest recovery ROI. Sign Up Free to build an OEE-focused maintenance calendar that targets the highest-impact losses first across Availability, Performance, and Quality.
Equipment Failures — Unplanned breakdowns from deferred bearing maintenance, seal failures, and component wear. Condition monitoring and predictive maintenance convert 70–80% of failures into planned interventions, recovering 8–15% Availability.
Setup & Adjustments — Extended changeover time from worn tooling, loose fixtures, and inadequate PM. Preventive mechanical maintenance reduces changeover by 20–35%, improving Availability for multi-product lines.
Minor Stops & Idling — Frequent small stops from sensor drift, valve stiction, and blocked filters. Quarterly preventive inspection and recalibration eliminate 60–75% of these losses within the first cycle.
Reduced Speed — Slow cycles from bearing wear, misalignment, friction losses, and inadequate lubrication. Vibration analysis and bearing replacement recover 4–9% Performance when maintenance intervals align with wear signatures.
Startup Rejects — Defects during ramp-up from thermal drift, loose tolerances, and calibration creep. Preventive calibration and thermal management controls reduce startup rejects by 40–60%.
Production Rejects — Defects during steady-state from vibration, misalignment, and component wear. Vibration-based maintenance prevents 50–70% of quality losses that accumulate from ignored machine condition warnings.
Maintenance-Driven OEE Improvement Tasks and KPI Impact Mapping
A complete OEE improvement program links each maintenance task directly to OEE component recovery with documented baseline-versus-post-maintenance measurement. Plant directors who treat OEE and maintenance as separate functions miss the closed-loop opportunity that produces 25–40% cumulative improvement. Book a Demo to see how Oxmaint measures OEE impact from maintenance work orders in real-time.
| Six Big Loss | Maintenance Intervention | OEE Component Impact | Frequency | Typical Recovery |
|---|---|---|---|---|
| Equipment Failures | Predictive sensors + vibration analysis + bearing replacement on wear signature | Availability +8–15% | Continuous + Quarterly | Convert 70–80% unplanned to planned downtime |
| Setup & Changeover | Preventive fixture maintenance, tooling inspection, guide lubrication | Availability +3–8% | Semi-annually | 20–35% reduction in changeover time |
| Minor Stops & Idling | Sensor calibration, valve maintenance, filter cleaning, air system audit | Performance +4–8% | Quarterly to monthly | Eliminate 60–75% of stop events |
| Reduced Speed | Bearing replacement, shaft alignment, motor lubrication, belt tension | Performance +4–9% | Semi-annually to annual | Recover 4–9% cycle speed loss |
| Startup Rejects | Thermal imaging for temperature drift, calibration verification, tolerance inspection | Quality +2–5% | Prior to production runs | 40–60% reduction in ramp-up defects |
| Production Rejects | Vibration analysis + alignment + spindle runout verification + tool change | Quality +3–7% | Monthly to quarterly | 50–70% reduction in defect rate |
Building an OEE-Driven Maintenance Program Using CMMS and Real-Time Monitoring
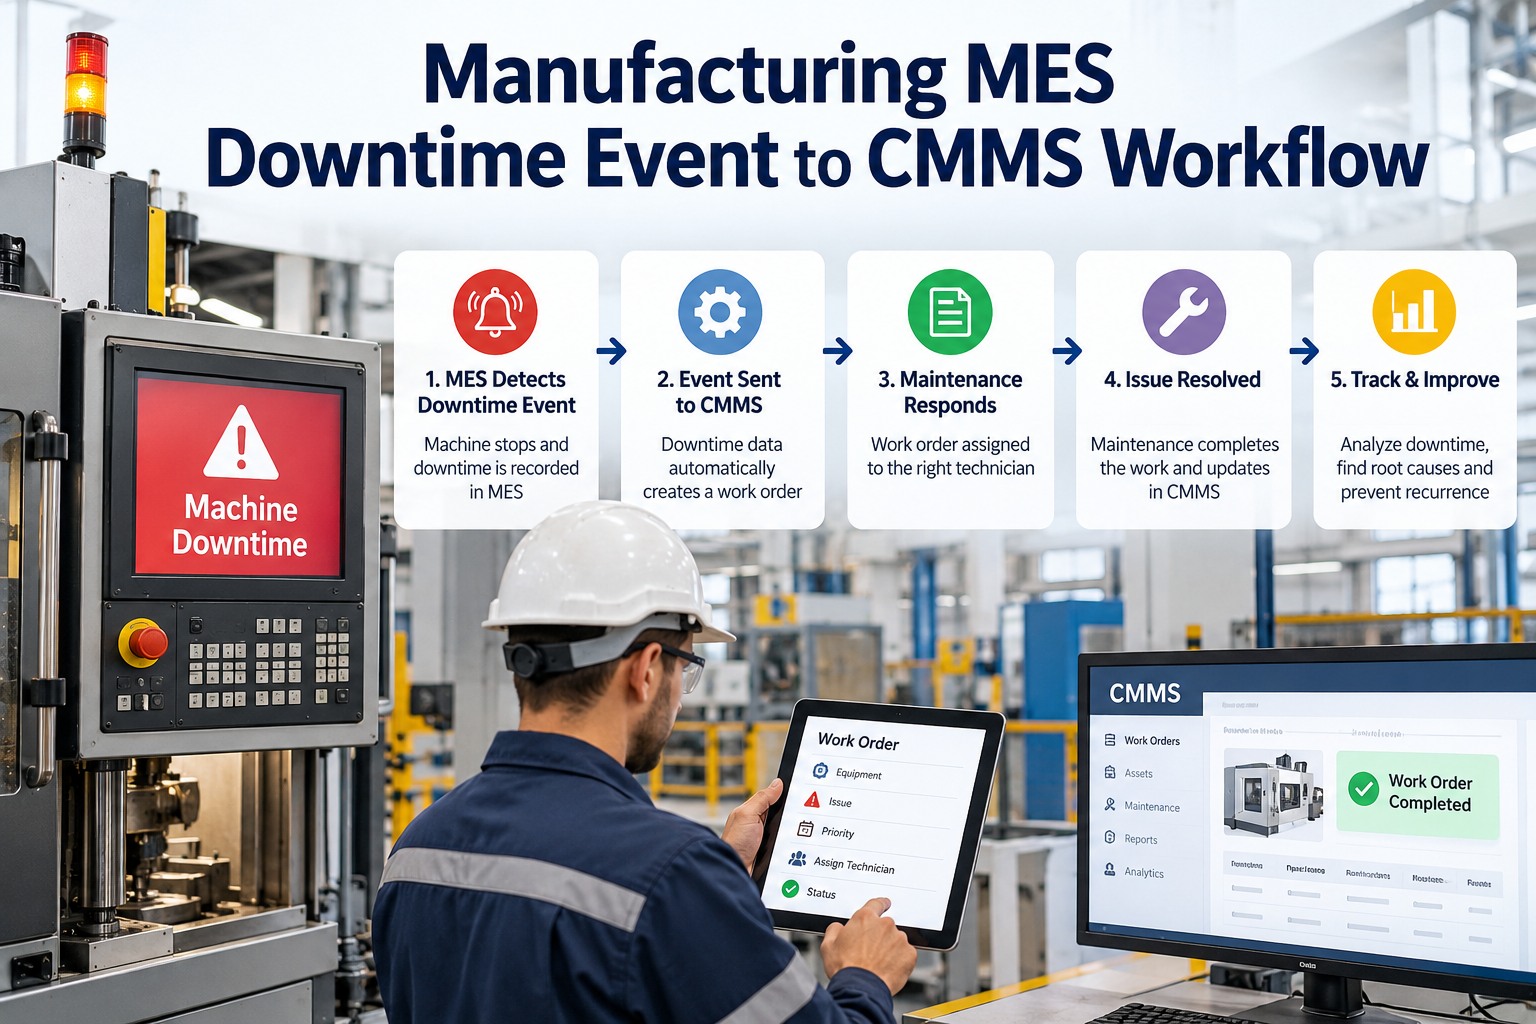
Manufacturing plants that achieve and sustain world-class OEE use centralized CMMS platforms integrated with OEE analytics, condition monitoring, and predictive algorithms to convert maintenance from a reactive cost into a production optimization tool. Closed-loop workflows where OEE alerts trigger work orders and maintenance completion validates OEE recovery eliminate the guesswork. Sign Up Free and link your first equipment to OEE tracking and auto-triggered preventive maintenance.
- Deploy IoT sensors or integrate PLC data to capture run time, cycle time, and output count automatically
- Establish reason codes for downtime, speed loss, and defects aligned to the Six Big Losses framework
- Calculate baseline OEE across all equipment and identify the equipment with lowest OEE as improvement focus
- Configure automated work order generation when OEE drops below thresholds (e.g., trigger WO when Availability drops below 85%)
- Link specific Six Big Loss codes to predefined maintenance actions (e.g., "Reduced Speed" auto-creates bearing inspection WO)
- Assign PM tasks with OEE recovery targets documented in each work order for accountability and measurement
- Install vibration sensors on rotating equipment to detect bearing wear weeks before failure
- Use thermal imaging monthly to catch temperature drift indicating friction or upcoming failures
- Configure predictive algorithms to flag equipment trending toward OEE thresholds for proactive maintenance scheduling
- Measure OEE before and after major maintenance interventions (e.g., bearing replacement, alignment work)
- Calculate maintenance ROI by dividing capacity value of OEE recovery by maintenance cost
- Generate monthly OEE trend reports showing impact of maintenance discipline on equipment effectiveness and production capacity
OEE Improvement Patterns: Common Maintenance Opportunities and Quick Wins
OEE Success Metrics: KPIs That Prove Maintenance-Driven Improvement
Manufacturing plants tracking measurable OEE improvement link maintenance performance directly to production metrics. When leadership sees that 100% PM compliance correlates with 82% OEE versus 65% OEE with 75% compliance, maintenance investment becomes justified. Sign Up Free to access OEE and maintenance KPI dashboards that demonstrate closed-loop value.
Primary production metric combining Availability, Performance, and Quality. Monthly measurement shows maintenance impact on equipment effectiveness. World-class: 85%. Typical: 60%. Industry: 40–50%.
Percentage of scheduled PM tasks completed on or before due date. Below 85% compliance predicts OEE decline within 60–90 days. Automated CMMS scheduling and work order alerts drive compliance above 90%.
Hours or days between unplanned equipment failures. Rising MTBF indicates predictive maintenance effectiveness—converting early failures into planned interventions. Improvement: 40–50% MTBF increase typical within 12 months.
Average time to complete a repair from failure detection to equipment return-to-service. Declining MTTR through parts pre-staging, technician training, and planned vs. emergency prioritization. Improvement: 30–40% reduction typical.
Percentage of scheduled production time lost to unplanned equipment failures. Direct indicator of maintenance strategy effectiveness. Predictive maintenance reduces unplanned downtime 40–60% within first 12 months.
ROI of maintenance interventions measured by production capacity recovered divided by maintenance labor and parts cost. Highest-ROI tasks: bearing replacement, alignment, calibration, lubrication interval optimization.