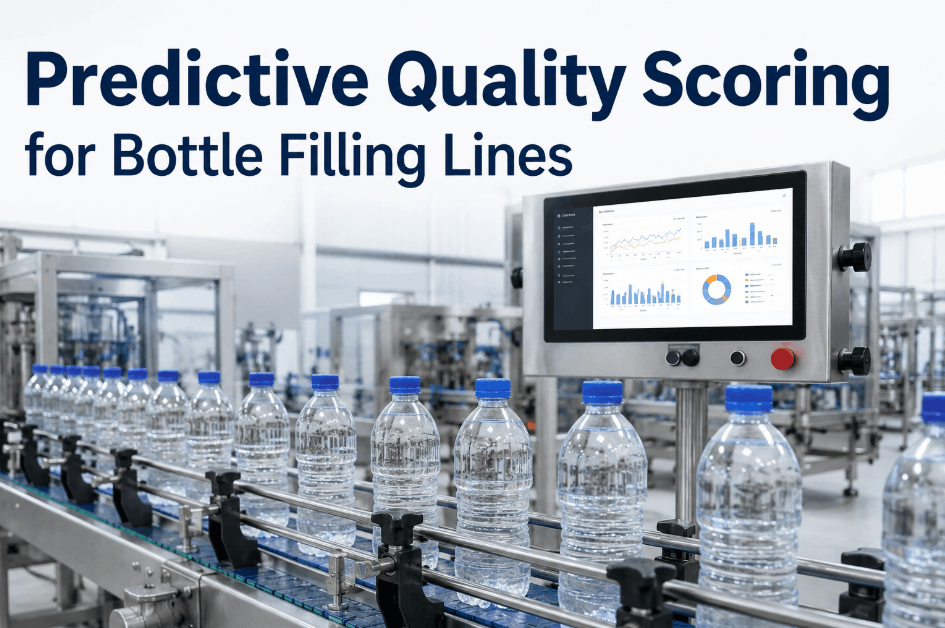
Bottle filling lines generate a steady stream of fill-level readings, sensor data, and defect counts — but when that data lives in separate quality logs disconnected from maintenance records, rework and scrap decisions only get made after the problem has already produced bad bottles. Oxmaint's Statistical Quality Control feature ties fill-level, torque, and sensor data directly to control limits configured per line, flagging out-of-spec readings the moment they occur instead of after a batch review. Sign Up Free to set up control charts on your filling line sensors today. Paired with predictive scoring that reads fill-level drift and defect frequency together, and AI Vision Camera monitoring on filling and capping stations, Oxmaint gives quality and maintenance teams a shared, real-time quality score instead of two disconnected systems. Book a Demo to see predictive quality scoring running against your actual filling line data.
Catch Fill-Level Drift Before Rework and Scrap Pile Up
Oxmaint scores quality from fill-level trends, sensor drift, and defect frequency in real time, so out-of-spec conditions are flagged at the source rather than discovered at the end of the run.
Why Bottle Filling Line Quality Problems Surface Too Late
Filling line quality data is often captured but rarely connected into a single, real-time control signal — leaving deviations to be discovered only after they've already cost product. Book a Demo to review how your current fill-level and defect data could feed a live quality score.
6 Ways Oxmaint Scores Quality on Bottle Filling Lines
Oxmaint connects statistical quality control, predictive scoring, AI vision, and maintenance work orders into one workflow for filling line quality. Sign Up Free to configure quality control limits for your filling line in Oxmaint.
- Control limits configured per fill parameter and filling head
- Fill-level, torque, and sensor data captured continuously
- Out-of-control points flagged the moment they occur
- Control charts shared between quality and maintenance teams
- Quality scores calculated from fill-level trends, sensor drift, and defect frequency together
- Score declines flagged before scrap volume rises
- Score history retained per filling head and product run
- Score drops trigger proactive maintenance work orders
- Camera monitoring of fill levels, cap seating, and visible leaks
- Detected defects logged with photo evidence per station
- Detection confidence recorded against each flagged event
- Confirmed issues auto-create prioritized work orders
- Out-of-spec readings auto-generate work orders linked to the filling head
- Technician assigned automatically based on certification
- Retest readings recorded against the original deviation
- Closure timestamps logged for every corrected deviation
- Sensor drift trends tracked per filling head over time
- Calibration history recorded against each sensor asset
- Recalibration work orders scheduled proactively from drift trends
- Drift-related deviations flagged separately from mechanical faults
- Scrap and rework rates viewed alongside maintenance history
- Defect frequency reported by line, shift, or product run
- Quality score trends exportable for management review
- Cross-reference between quality events and asset condition
Quality Monitoring Priorities by Filling Line Type
Quality risk and control priorities shift depending on the product and the filling process. The table below maps line type to the monitoring focus that matters most.
| Filling Line Type | Primary Quality Risk | Key Monitoring Focus | Oxmaint Priority | Audience |
|---|---|---|---|---|
| Carbonated Beverage Lines | Fill-level and pressure variance | Real-time control chart monitoring | Statistical Quality Control | Quality Manager |
| Still Water & Juice Lines | Cap seating and seal integrity | Vision-based defect detection | AI Vision Camera | Line Supervisor |
| Dairy Filling Lines | Sensor drift affecting fill accuracy | Calibration and drift tracking | Component Verification | Plant Manager |
| Pharma & Liquid Fill | Deviation traceability requirements | Documented deviation work orders | Deficiency Management | Compliance Officer |
| Multi-Product Co-Pack Lines | Cross-run defect trend visibility | Combined quality and maintenance reporting | Analytics & Reporting | Operations Director |
Score Quality in Real Time — Not After the Batch Review
Oxmaint connects statistical quality control, predictive scoring, AI vision detection, and automated work orders into one platform for filling line quality.
Frequently Asked Questions — Predictive Quality Scoring for Bottle Filling Lines
Give Your Filling Line a Quality Score It Can Act On
Statistical control charts. Predictive quality scoring. AI vision detection. Automated deviation work orders. One platform connecting quality and maintenance on the line.