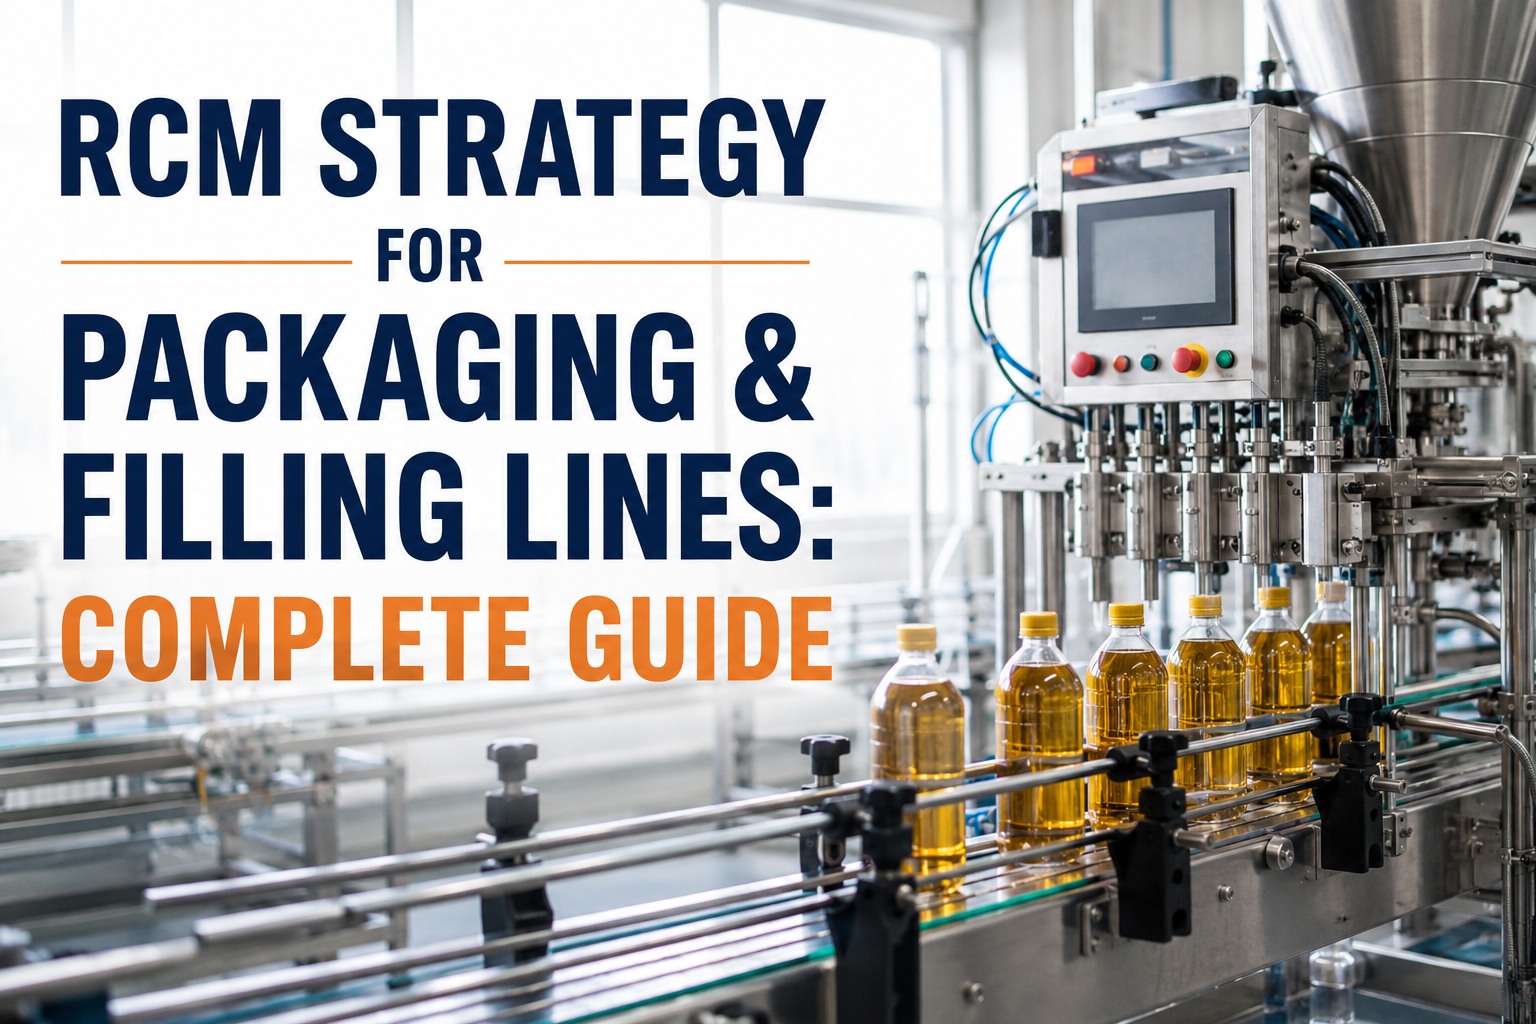
Packaging and filling lines are the final — and most fragile — link in a manufacturing plant. Fillers, cappers, labelers, case packers, and palletizers running 400–1,200 units per minute in serial dependency mean a single station stall shuts the whole line, and industry-average OEE sits between 55% and 72% almost entirely because of unplanned downtime that RCM was built to eliminate. This complete guide walks through the packaging-line-specific RCM strategy top FMCG plants actually deploy: the line-position bottleneck map, the 5×5 criticality matrix that classifies every asset by consequence and probability, the per-station FMEA anatomy for filler / capper / labeler / case packer, the RCM decision logic that selects between on-condition, scheduled, and run-to-failure tasks, and the CMMS configuration that keeps the analysis alive on the shop floor. Start free on OxMaint to load the packaging-line RCM template, or book a live demo to see criticality scoring on your line.
RCM Strategy for Packaging & Filling Lines · Where OEE Actually Comes From
Line-position criticality · per-station FMEA · CMMS-live task routing.
400–1,200
Units per minute typical for a modern FMCG filling line — one station's stall is the whole line's stall
30–60
Distinct failure modes a thorough FMEA surfaces on a full packaging line, per FMCG-plant experience
55–72%
Industry-average packaging-line OEE — world-class target sits at 85%+ and the gap is preventable downtime
3–4×
MTBF improvement documented on beverage lines that moved from calendar PM to RCM-driven task selection (900–1,400 hr → 3,200–4,100 hr)
Line-Position Bottleneck Map · Where Criticality Comes From on a Serial Line
Packaging is a serial system, so criticality can't be inherited from a plant-wide asset register — it comes from position on the line. The station that runs slowest sets the line speed; the station with the highest MTTR sets the recovery cost; the station with the least redundancy sets the true risk. The bottleneck map below is the first RCM output every packaging line should produce, before a single FMEA workshop is scheduled.
01
Depalletizer
Tier 3
Vacuum-cup wear · sensor misalignment · gripper drift · pallet-jam recovery
Buffer ≥ 5 min upstream — line survives brief stalls
→
02
Filler
Tier 1
Valve seat wear · piston seal fatigue · fill-volume drift · CIP chemistry attack on elastomers
Fill volume drifts weeks before catastrophic failure — long P-F interval
→
03
Capper
Tier 1
Chuck wear · torque drift · clutch slip · torque head misalignment
Torque drift trends over 2–4 weeks — SPC on application torque catches it
→
04
Labeler
Tier 2
Label web tension drift · applicator pad wear · vision reject spike
10–14 days early warning before adhesion failures cause rework
→
05
Case Packer
Tier 2
Grouper timing · flap-glue viscosity · knife wear · carton feeder jams
Buffer between labeler and case packer typically 60–120 sec
→
06
Palletizer
Tier 3
Robot end-effector · pallet magazine · stretch-wrap film break
Downstream buffer > 10 min — stall rarely halts upstream
Read this map
The Tier-1 stations — filler and capper — sit at the throat of the line with the smallest buffers and the highest safety and quality consequences (product contact, torque integrity). Everything upstream can stall briefly; everything downstream can absorb short pauses. Concentrating RCM effort on the throat delivers roughly 60–70% of the OEE recovery.
Criticality Matrix · Consequence × Probability for Every Line Asset
The RCM criticality matrix is the single most-referenced page of a mature reliability program. Every asset on the line gets plotted once by consequence of failure (safety, quality, downtime cost, environmental) and by probability of failure (failure history, age, operating hours). The upper-right quadrant absorbs 60–70% of preventive resources despite being 15–25% of the asset count — that is the intended shape.
5
Med-Hi
High
Critical
Critical
Critical Filler valve · Capper chuck
4
Medium
Med-Hi
High
Critical Labeler web tension
Critical
3
Low
Medium
Medium Case packer glue
Med-Hi
High
2
Low
Low Depalletizer cup
Medium
Med-Hi
High
1
RTF
Low Palletizer film
Low
Medium
Med-Hi
12345
← Probability of Failure
Critical — daily / weekly PM, CBM route, spare on-shelf, redundancy design review
High — weekly / monthly PM, CBM where technically feasible, spare on-shelf
Medium — monthly / quarterly PM, spare in central store
Low — TAR-cycle PM, corrective procedure documented
RTF — no PM, spare stocked, MTBF tracked
Per-Station FMEA Anatomy · What the Analysis Actually Surfaces
A rigorous FMEA on a full packaging line surfaces 30–60 distinct failure modes. Each critical asset yields 8–15 credible modes, and 3–7 functional failures. Below is the anatomy for the four highest-consequence stations — modes, detection technique, and P-F interval — as they appear on the shop floor once the analysis is done.
Filler · Tier 1
10–15 modes typical
Valve seat wearFill-volume SPC · weeks lead
Piston seal fatigueLeak-check + volume drift · 2–4 wk
CIP chemistry attack (elastomer)Scheduled restoration · CIP cycle count
Fill-nozzle drip / product-contact contaminationVisual + micro swab · every shift
Capper · Tier 1
8–12 modes typical
Chuck wear / cap-thread damageApplication torque SPC · 2–4 wk drift
Torque clutch slipTorque analyzer sample · monthly
Torque head misalignmentVisual + high-frequency reject watch
Cap-feed jam / orientation faultMTBF tracking + failure-finding test
Labeler · Tier 2
6–10 modes typical
Label web tension driftTension trend · 10–14 day lead
Applicator pad wearVision reject spike · condition-based
Peel-plate misalignmentVisual + reject-rate SPC · daily
Roller bearing wearVibration route · monthly
Case Packer · Tier 2
8–12 modes typical
Grouper timing driftServo-position log · condition-based
Flap-glue viscosity out of specTemperature + reject rate · daily
Carton-feeder jam recoveryDowntime-event log · failure-finding
Cut-knife wearCycle count + reject inspection · weekly
Load Your Packaging-Line FMEA Into a CMMS That Executes It — Free Forever
Sign up on OxMaint's free forever plan and import the per-station failure modes for filler, capper, labeler, and case packer. Each mode maps to on-condition, scheduled restoration, scheduled discard, failure-finding, or RTF — with the trigger, procedure, and spare-part reservation configured live. No card, no time limit.
The Four-Step RCM Deployment on a Packaging Line
Attempting RCM on every asset at once is the fastest way to stall a reliability program. The proven sequence below concentrates the effort where the OEE comes back — the throat of the line first, the supporting stations second, the redundant equipment last or never.
Step 01
Pareto & Bottleneck Ranking
Rank every asset on the line by safety, quality, downtime cost, and repair cost. A typical 150–200-asset packaging line yields 25–35 assets that drive 80% of OEE loss — that is the RCM iteration-one scope.
Step 02
FMEA With Boundary Definition
Define in-scope / out-of-scope per asset (filler = valve stack + CIP loop + product-contact seals, not the upstream pumps). Document every credible failure mode, effect, and consequence — hidden, safety, environmental, or operational.
Step 03
Task Selection Per Mode
Apply the RCM decision logic: on-condition where P-F interval is measurable, scheduled restoration where wear-out age exists, scheduled discard where replace-regardless is cheaper, failure-finding for hidden functions, RTF where consequences and cost allow.
Step 04
CMMS Configuration & Feedback Loop
Each task becomes a CMMS PM with a trigger (time / run-hour / cycle count / sensor threshold), procedure, spare reservation, and KPI feed. Actual failure events feed back to update the FMEA — the analysis stays alive.
Packaging KPIs That Prove the Program Is Working
An RCM program without live KPIs is a study on the shelf. The set below is the tight dashboard packaging plant managers actually open, with the benchmark ranges FMCG plants have documented on real deployments.
Line OEE
Baseline: 55–72% · Target: 85%+
Availability × Performance × Quality per line, per shift. RCM-driven task selection typically lifts OEE by 12–17 points in 12–18 months.
Unplanned Downtime %
Baseline: 9–10% · Target: < 3%
Segmented by station and failure mode — the code every operator selects at stoppage feeds the FMEA update.
MTBF (Critical Equipment)
Baseline: 900–1,400 hr · Target: 3,200–4,100 hr
3–4× improvement on beverage lines that moved from calendar PM to RCM-driven CBM has been documented across multi-facility case data.
PM Compliance
Baseline: 68–71% · Target: ≥ 94%
Rises sharply once RCM prunes the over-scoped calendar library — fewer, higher-value PMs are actually completable.
Changeover Time
Track per SKU pair · target trending down
Preventive tasks scheduled inside changeover windows recover 60–90 minutes per week without added downtime.
Backlog / Schedule Compliance
Backlog 2–4 wk · Schedule ≥ 85%
The single strongest predictor of quarter-over-quarter OEE improvement across FMCG packaging deployments.
How OxMaint Runs the Packaging-Line RCM Strategy
The bottleneck map, criticality matrix, per-station FMEA anatomy, four-step deployment, and KPI dashboard all run on one CMMS — asset hierarchy that matches line/station/module, condition-based triggers wired to vibration and vision, mobile work orders on the phone, and a KPI feed that opens to the plant manager on the first shift.
Structure
Line → Station → Module Hierarchy
Packaging-native hierarchy so every asset ID maps up to line/station and down to the failure-mode library.
Score
Auto Criticality Matrix Plot
Built-in scoring engine plots each asset on the 5×5 consequence × probability grid and flags iteration-one RCM candidates.
Analyze
FMEA Templates Per Station
Pre-configured filler / capper / labeler / case-packer templates with the mode libraries already loaded — analysis in hours, not weeks.
Execute
Mobile Work Orders With Spare Reserve
Technicians complete on the phone with photo, parts drawn against reservation, actual time captured against the failure mode.
Monitor
IoT + Vibration + Vision Overlay
Threshold triggers from torque analyzer, vibration route, and vision reject rate fire auto work orders per RCM decision.
Prove
OEE + MTBF Dashboard + Audit Pack
Line OEE, MTBF, PM compliance, backlog, and schedule compliance rolled up per line. ISO 55000 / SQF audit pack exports on demand.
Move Your Packaging Line From Calendar PM to RCM-Driven Reliability
Free forever plan — no card, no time limit. Load your line, plot every asset on the 5×5 matrix, and every critical mode maps to a live CMMS trigger before the next changeover. Or book 30 minutes and we'll walk your filler / capper / labeler end-to-end on the platform.
Frequently Asked Questions
How many failure modes should an RCM analysis surface on a packaging line?
A rigorous FMEA on a full packaging line typically surfaces 30–60 distinct failure modes. Each complex asset — filler, capper, labeler, case packer — yields 8–15 credible modes and 3–7 functional failures. Anything materially below that range usually means the analysis was rushed or the boundary definition was too narrow.
Which packaging-line assets should the first RCM iteration cover?
Start with the throat of the line — the filler and the capper. Both are Tier-1 critical, sit between the smallest buffers, carry product-contact and torque-integrity consequences, and drive the majority of preventable downtime. A typical 150–200-asset packaging line yields 25–35 assets that drive 80% of OEE loss, and roughly 60–70% of the OEE recovery comes from the throat stations alone.
Book a demo to see the criticality scoring on your line.
What OEE and MTBF improvement is realistic from an RCM program?
Documented FMCG-plant case data across multiple beverage facilities shows OEE improving from a 62–64% baseline to 76–79% within 12–18 months, unplanned downtime dropping from 9.8–10.2% to 2.1–2.4%, PM compliance climbing from 68–71% to 94–96%, and MTBF on critical equipment improving from 900–1,400 hours to 3,200–4,100 hours. The common success factor is treating maintenance KPIs as business-critical metrics and enforcing CMMS discipline every shift.
How does the RCM decision logic route failure modes to CMMS task types?
Every credible failure mode maps to one of five task types: on-condition (P-F interval measurable — vibration, torque SPC, fill-volume drift), scheduled restoration (wear-out age known — CIP-cycle-driven seal replacement), scheduled discard (replace-regardless — filter cartridges, applicator pads at cycle count), failure-finding (hidden protective functions — pop-testing, function tests), or run-to-failure (no safety/quality consequence and spare on shelf — non-critical utility motors). Each type becomes a specific CMMS trigger configuration.
Does OxMaint support ISO 55000 and SQF audit reporting for packaging lines?
Yes. Every completed work order, PM compliance record, corrective action, and failure-mode update stays attached to the asset and rolls up into an audit-ready evidence pack. ISO 55000 asset-management, SQF Edition 9 maintenance-schedule-and-completion-records, and internal reliability audits export on demand — the same data the plant manager sees on the KPI dashboard is what the auditor receives, no separate report build required.
Sign up free to enable it on your first shift.