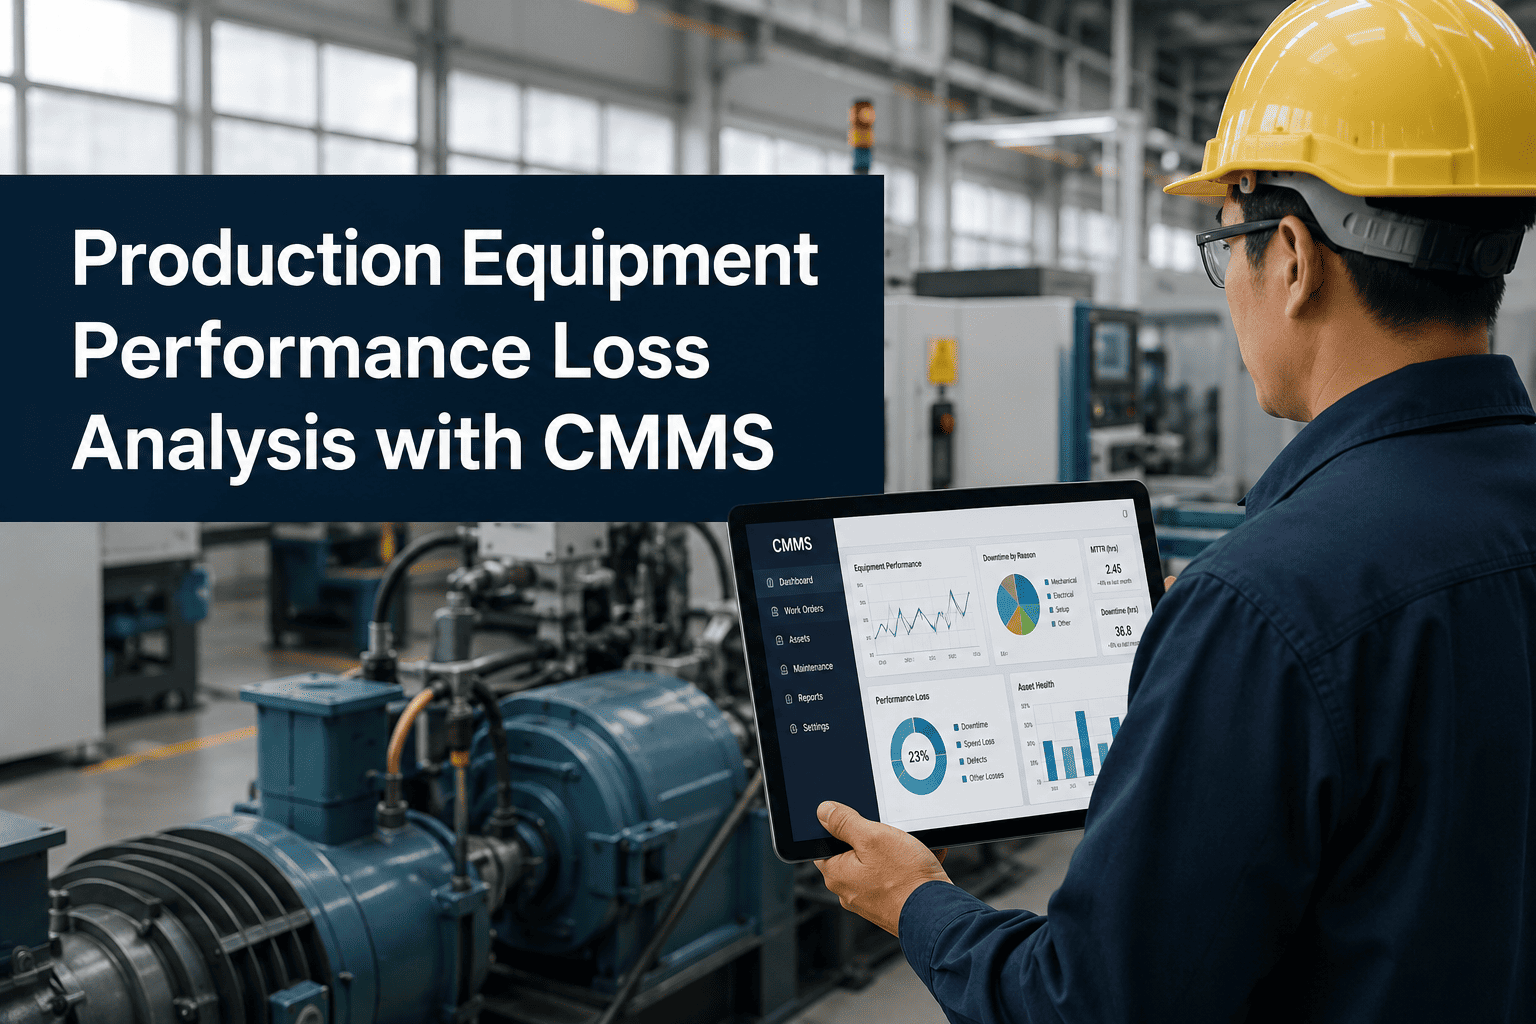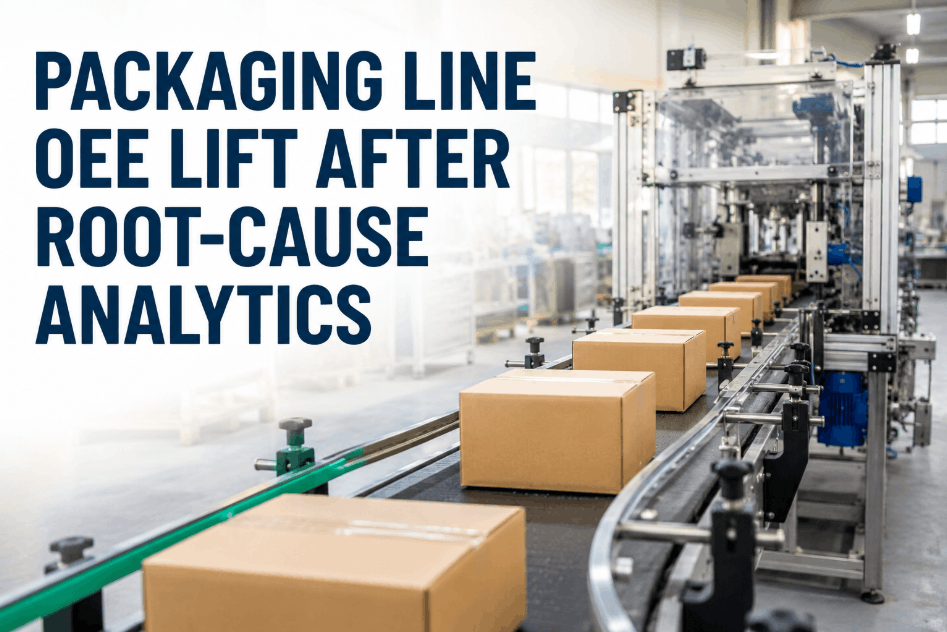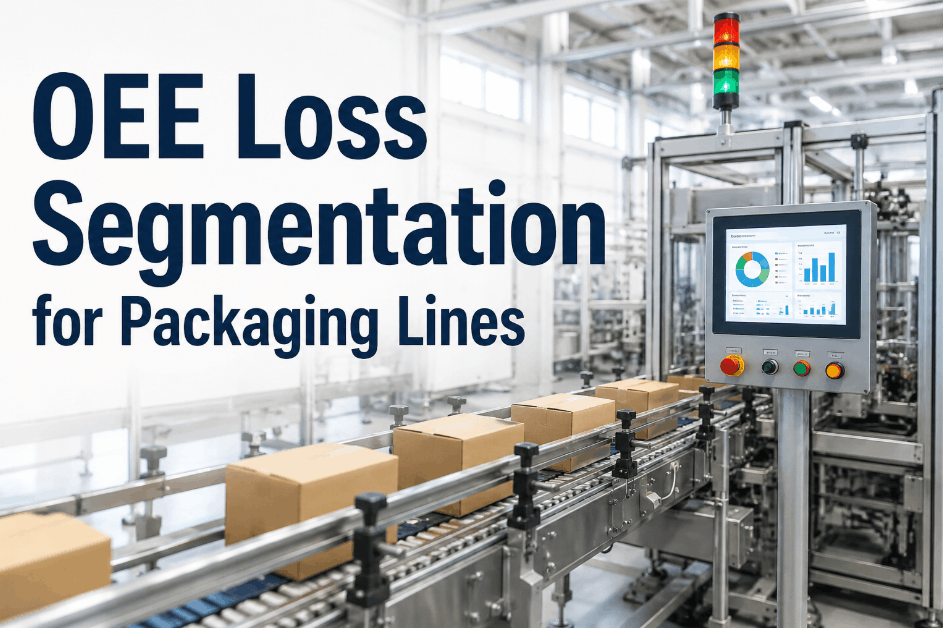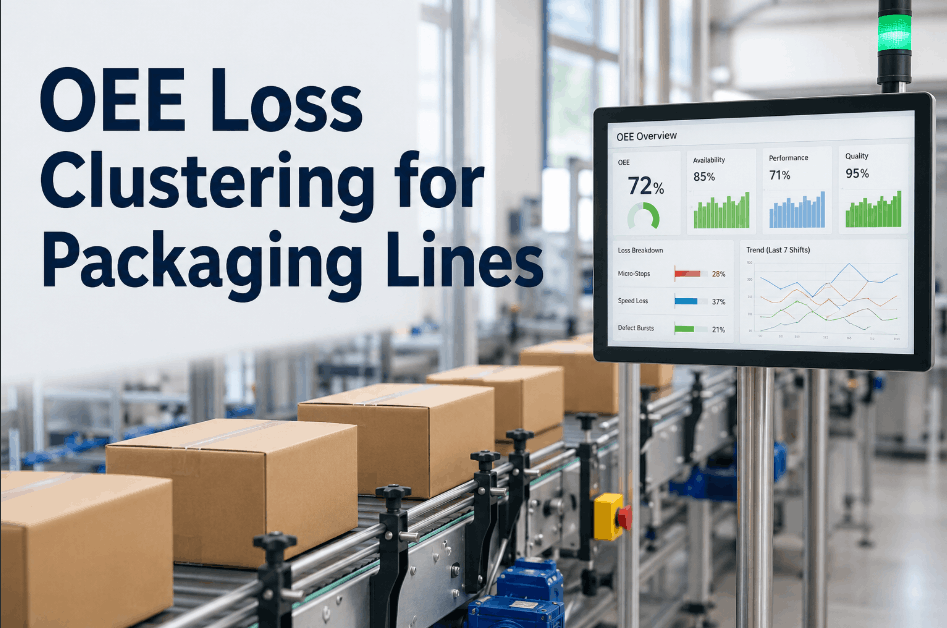
OEE loss on packaging lines is rarely one problem — it is dozens of micro-problems that aggregate into a throughput drag that looks chronic but is actually addressable. When teams treat OEE as a single metric rather than a cluster of distinct loss types, improvement efforts scatter across the entire line instead of concentrating on the losses driving the most impact. Micro-stops, speed losses, and defect bursts each have different root causes, different asset owners, and different intervention pathways — but standard OEE dashboards blend them into a number that tells you how bad the shift was without telling you where to look. Packaging operations teams that Sign Up Free on Oxmaint can map downtime events and quality losses to specific equipment records, cluster stop patterns by loss category and frequency, and generate maintenance work orders targeting the highest-impact loss sources before the next shift begins. Production managers looking to attack the real drag on packaging throughput can Book a Demo to see how Oxmaint connects OEE loss data to asset-level maintenance execution.
Oxmaint maps packaging line stop events to asset records, clusters loss patterns by type and frequency, and routes work orders to the equipment driving your highest OEE impact.
7 OEE Loss Clustering Principles That Define Packaging Line Throughput Improvement
OEE loss clustering converts raw stop data into an improvement roadmap by grouping events that share the same root cause, asset, or failure pattern. Without clustering logic, packaging teams chase symptoms rather than sources — reacting to the most recent stoppage rather than the pattern that is consistently eroding throughput. Operations teams that Sign Up Free on Oxmaint can attach stop events to specific packaging line assets, configure loss category classifications, and view clustered pattern data alongside open work orders for the same equipment.
Micro-stops — unplanned stoppages under two minutes — are the highest-frequency and lowest-visibility OEE loss category on most packaging lines. They must be isolated from planned stops and changeovers before clustering begins, or their cumulative throughput impact remains hidden inside the broader downtime figure.
A wrapper that stops 40 times per shift for five seconds each is a different problem class than a labeller that stops three times per shift for 90 seconds. Clustering micro-stops by originating asset and frequency band separates high-frequency nuisance events from low-frequency mechanical issues — each requiring a different maintenance response.
Lines running at 80% of rated speed lose throughput without generating any stop events — making speed loss invisible in downtime-only OEE reporting. Identifying speed loss as a separate cluster requires comparing actual line rate against nameplate rate continuously, then investigating the asset conditions — drive wear, tension drift, tooling wear — that prevent rated speed from being sustained.
Defect bursts — short periods of elevated reject rates — are typically traceable to a specific asset transition: a seal jaw temperature exceedance, a date code head drift, a label tension change. Clustering defect events by the time window and line zone where they occur focuses quality investigation on the process control boundary rather than the downstream detection point.
The highest-frequency loss cluster is rarely the highest-impact one. Weighting clusters by total throughput minutes lost — duration multiplied by line rate loss — ensures improvement effort targets the losses that are actually limiting production output rather than the events that appear most often on the stop log.
OEE loss clusters that align with assets that have overdue PM tasks or open condition alerts are the highest-confidence maintenance targets. Cross-referencing loss cluster data with maintenance history distinguishes degradation-driven losses from process setup or operator behavior issues — preventing misrouted maintenance work orders.
The ultimate validation of a loss clustering program is whether identified clusters disappear after targeted intervention. Tracking cluster resolution rate — what percentage of identified loss patterns are eliminated within a defined window — gives production managers a leading throughput indicator that precedes OEE improvement by weeks.
OEE Loss Cluster Matrix: Loss Type, Packaging Asset, Root Cause Pattern, and Maintenance Response
Each OEE loss type on a packaging line maps to characteristic asset failure patterns and maintenance responses. Use this matrix to align your loss clustering methodology with the right diagnostic and intervention pathway for each event category. Packaging operations running reactive maintenance programs are encouraged to Book a Demo to see how Oxmaint's asset-linked work order system turns OEE loss data into targeted maintenance dispatch.
| Loss Type | Packaging Asset | Root Cause Pattern | Maintenance Response | Priority |
|---|---|---|---|---|
| High-frequency micro-stops | Wrapper / form-fill-seal | Film tension drift, jaw wear | Tension calibration + jaw inspection work order | Critical |
| Speed loss sustained | Conveyor / transfer | Drive belt wear, accumulation backup | Belt tension check + flow balancing review | Critical |
| Defect burst — seals | Heat sealer / pouch line | Jaw temperature exceedance | Temperature controller calibration and dwell check | Critical |
| Low-frequency long stops | Case erector / packer | Mechanical jam, worn pick heads | Scheduled PM — pick head inspection and lubrication | Important |
| Defect burst — labelling | Label applicator | Dispensing tension drift, head alignment | Head alignment check + web tension adjustment | Important |
| Changeover time excess | Full line | Setup procedure variability | SMED analysis + operator checklist standardization | Routine |
How Packaging Operations Build OEE Loss Clustering Without a Dedicated Data Analytics Team
OEE loss clustering does not require a manufacturing analytics platform or a data science team. Oxmaint gives packaging operations the asset hierarchy and work order execution layer to capture stop events against specific line equipment, classify losses by type at the point of logging, and route clustered findings into maintenance work orders automatically. Facilities can Sign Up Free and begin mapping stop events to packaging line asset records from the first session. Operations managers looking to build a structured loss clustering methodology for their packaging environment can Book a Demo to see how the asset-linked downtime and work order layer works in live production environments.
- Stop events and quality rejects logged against specific packaging line assets in the Oxmaint hierarchy
- Loss category classification — micro-stop, speed loss, defect burst, planned — captured at point of event entry
- Loss cluster dashboards show pattern frequency, total throughput impact, and asset concentration by shift and line
- Cross-reference alerts link high-frequency loss clusters to open maintenance work orders on the same asset
- Condition-triggered work orders generated automatically when loss cluster thresholds breach configured limits
- Cluster resolution tracking confirms whether targeted maintenance interventions eliminated identified loss patterns
- No analytics team? Loss clustering dashboards surface patterns from structured stop event data without specialist analysis
- Micro-stops not captured? Mobile-first logging with one-tap loss categorization reduces entry friction to seconds
- Speed loss invisible in downtime reports? Asset-level rate tracking surfaces speed degradation as a distinct loss category
- Multiple packaging lines? Line-level loss segmentation isolates highest-impact equipment across the full production floor
- Maintenance and production disconnected? Asset-linked work orders bridge OEE loss data to maintenance execution directly
- Compliance or customer audit requirements? Timestamped stop event records and loss history support quality system documentation
OEE Loss Clustering ROI: What Targeted Throughput Improvement Delivers for Packaging Operations
Per-user SaaS pricing with no MES integration required. Most packaging facilities configure stop event classification and loss cluster dashboards within 30 days using Oxmaint's no-code setup tools.
Micro-stop clustering on high-frequency packaging equipment typically reveals 3–8% of total line throughput lost to events that individually appear trivial. Targeted intervention on identified clusters converts that hidden capacity into recoverable output without capital investment.
Loss cluster weighting by throughput impact directs maintenance effort to the assets generating the most production drag — eliminating speculative PM work on healthy equipment and concentrating technician time where OEE recovery is measurable and confirmed.
Defect burst clustering traces quality losses to the specific process control failure — seal jaw temperature, label tension, fill weight drift — that generated the burst. Targeted correction of the root asset condition eliminates the repeat quality event rather than adjusting downstream detection thresholds.
Packaging lines that have operated below rated OEE for years often have improvement opportunities clustered in a small number of high-impact loss patterns. Structured clustering identifies these quickly — enabling improvement results within the first 60–90 days rather than after months of broad analysis.
Structured OEE loss records demonstrating systematic improvement methodology support customer audits, food safety compliance programs, and internal governance reviews — providing documented evidence of operational discipline beyond the aggregate OEE number.
Oxmaint gives packaging teams asset-linked loss tracking, cluster pattern dashboards, and automatic work order dispatch — go live in 30 days without a manufacturing analytics platform.
OEE Loss Clustering for Packaging Lines — Questions Production Teams Ask
OEE loss clustering groups packaging line stop events and quality losses by shared characteristics — asset of origin, loss type, frequency band, and time window — to surface the specific patterns driving throughput drag rather than presenting all losses as an undifferentiated downtime total.
Micro-stops are brief unplanned stoppages — typically under two minutes — that generate stop events in the production log. Speed loss is throughput degradation from a line running below rated speed without triggering a stop event, making it invisible in downtime-only OEE reporting but measurable through rate comparison against nameplate capacity.
Oxmaint captures stop events and quality rejects against specific packaging line assets with loss category classification at the point of entry, surfaces clustered loss patterns in dashboards segmented by asset and shift, and routes work orders to the highest-impact equipment automatically when cluster thresholds are exceeded.
Defect bursts appear as short periods of elevated reject rates clustered within a specific time window, typically traceable to a process control event — a jaw temperature exceedance, a fill weight shift, a label tension change. Chronic quality loss appears as a consistently elevated baseline reject rate with no burst pattern, indicating a systemic process capability issue rather than an equipment event.
Yes. Oxmaint's multi-line asset hierarchy supports loss cluster dashboards segmented by line, shift, and production area — allowing operations managers to compare throughput drag patterns across the full packaging floor and prioritize maintenance resources toward the lines showing the highest OEE impact clusters.
Oxmaint gives packaging operations asset-linked stop tracking, OEE loss pattern dashboards, and automated maintenance dispatch — no dedicated analytics team required.