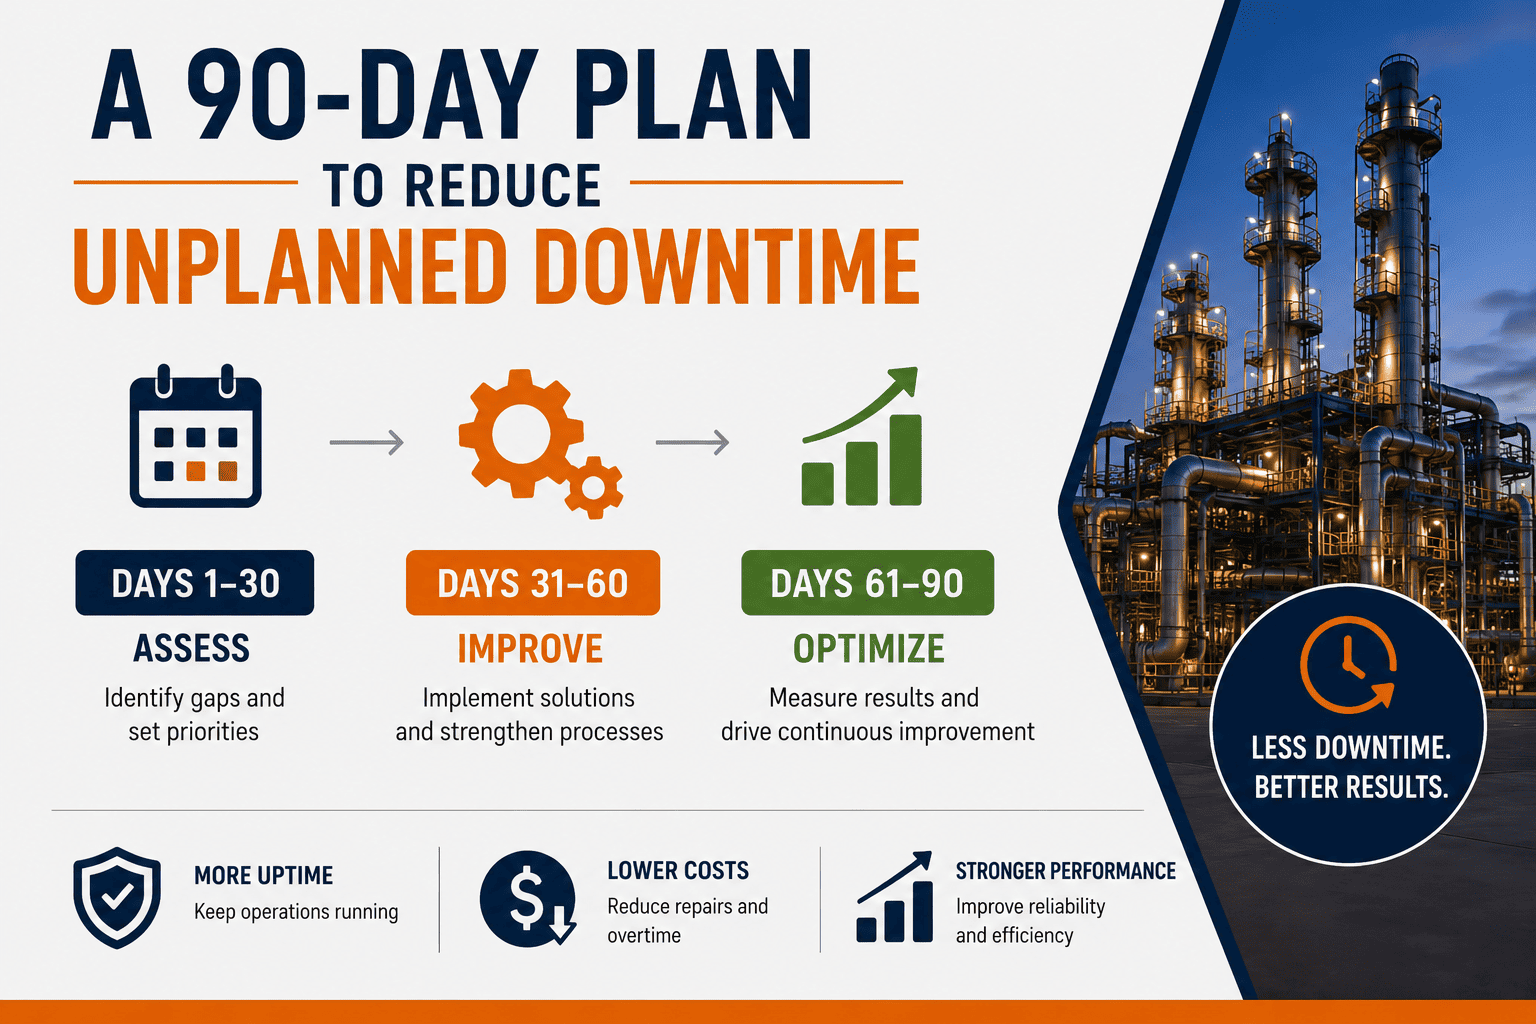
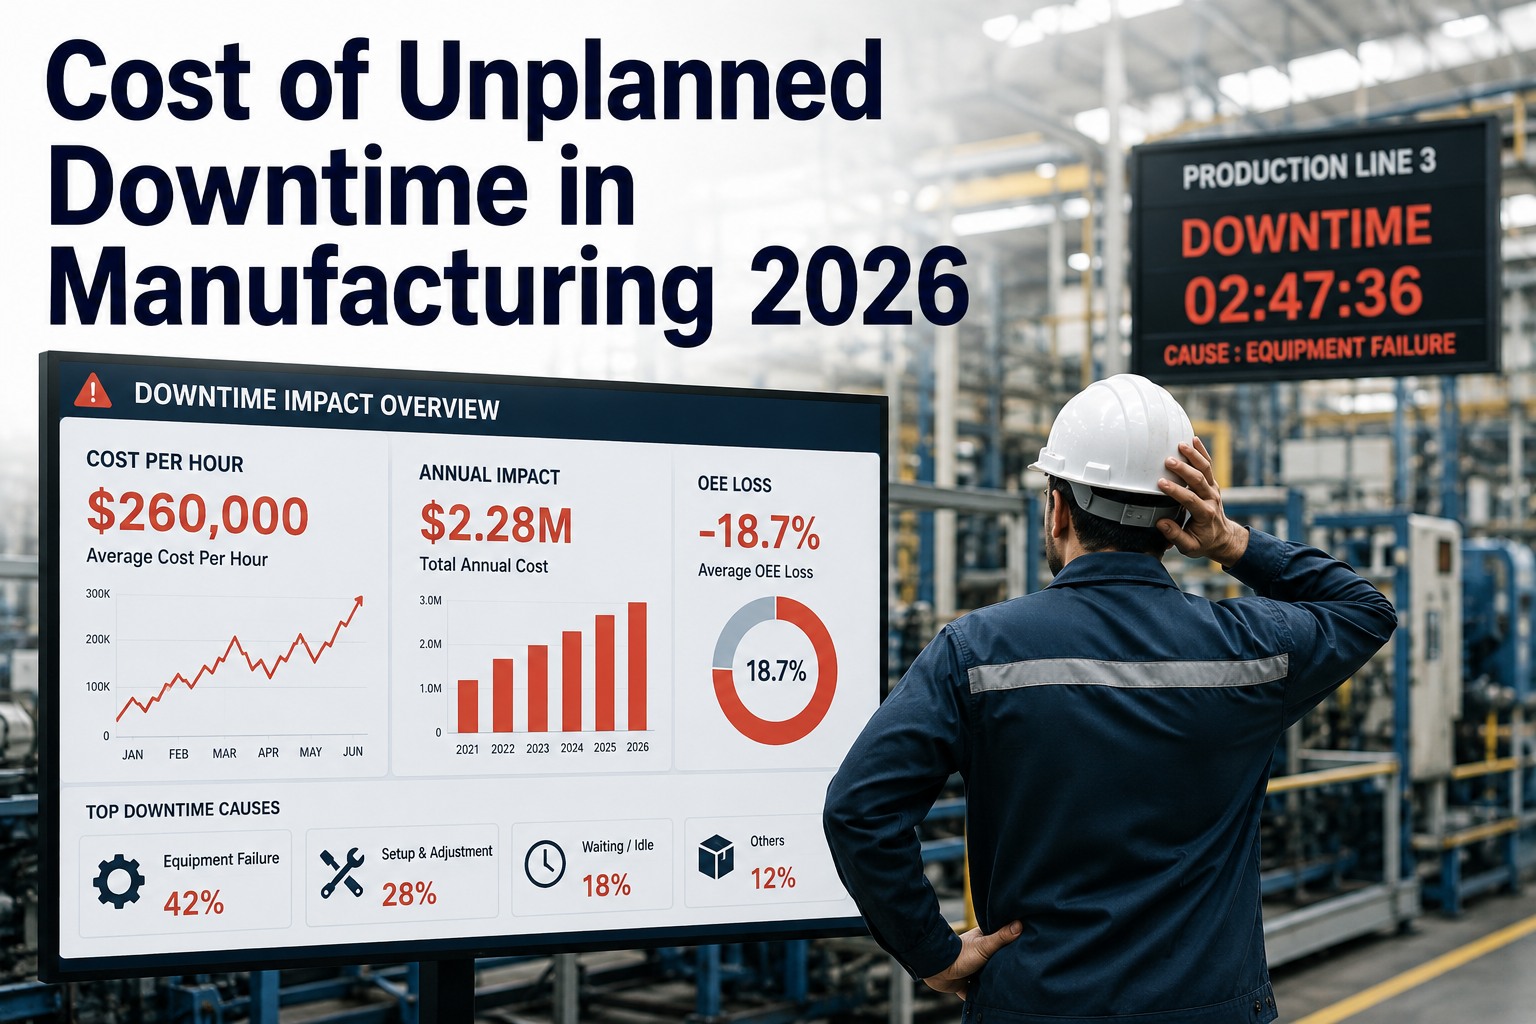
Unplanned downtime costs manufacturers an estimated $50 billion annually, with a single hour of stopped production reaching $260,000 in heavy industries. A practical 90-day plan to reduce unplanned downtime can knock 20–40% off your top-loss assets without a multi-year transformation. By targeting bad actors, deploying quick-win PMs, and establishing a weekly cadence, your plant can achieve measurable manufacturing uptime improvement in just one quarter. Ready to accelerate your downtime elimination strategy? You can Start Free Trial today and digitize your maintenance operations in minutes.
Downtime Reduction Roadmap
What if you could cut your worst equipment failures by 40% in the next 90 days?
Most plants don't need a multi-year digital transformation to reduce unplanned downtime — they need a focused 90-day maintenance plan that targets top-loss assets, implements predictive triggers, and builds a weekly cadence that prevents momentum from stalling at day 45. Here's the exact downtime reduction strategy that works.
The 90-Day Downtime Elimination Strategy
How to Reduce Unplanned Downtime in 90 Days: A Phase-by-Phase Timeline
A successful downtime improvement plan unfolds in three 30-day phases. Each phase builds on the last — you cannot jump to predictive triggers without first identifying your bad actors and stabilizing your preventive maintenance baseline.
Phase 1: Bad Actor Identification & Quick-Win PMs
Target: Identify the top 20% of assets causing 80% of unplanned downtime and cut 10–15% of losses through immediate PM adjustments.
- Pull 12 months of work order history and breakdown logs to rank assets by downtime hours and MTBF.
- Audit existing PMs on top 10 bad actors — 40% are typically under-lubricated, over-lubricated, or on wrong intervals.
- Walk down each critical asset with operators to capture obvious failure modes (leaks, vibration, heat) missed by your CMMS.
- Adjust PM frequencies immediately where data shows failures occurring between scheduled inspections.
Phase 2: Criticality Reassessment & Predictive Triggers
Target: Re-rank assets by production-criticality (not just failure frequency) and deploy condition-based triggers on top 5 loss drivers.
- Reassess asset criticality using a risk-based matrix: probability of failure × production impact × safety/environmental risk.
- Install vibration, temperature, or oil-analysis sensors on the 5 assets responsible for the most downtime hours.
- Set alarm thresholds based on ISO 10816 vibration standards and OEM baseline data — not guesswork.
- Convert 30% of time-based PMs to condition-based triggers where sensor data supports it.
Phase 3: Autonomous Maintenance & Weekly Cadence
Target: Lock in gains with a sustainable weekly cadence and deploy operator-led autonomous maintenance basics on top 10 assets.
- Train operators on clean-inspect-lubricate (CIL) routines for their assigned equipment — a core TPM pillar.
- Establish a weekly 30-minute downtime review meeting: top 3 losses, root cause, corrective action, owner, due date.
- Implement a feedback loop so operators can flag emerging issues directly into the CMMS without calling maintenance.
- Measure baseline vs. current MTBF, MTTR, and OEE on all targeted assets — publish results visibly.
Downtime Quick Wins
Downtime Quick Wins: What to Fix in Week One
You don't need 90 days to see results. These four quick wins can reduce equipment downtime within the first week of your plant uptime plan — each takes less than a day to implement and requires zero capital expenditure.
Audit PM Compliance on Top 5 Assets
If PM compliance is below 85%, you're already losing. Check completion rates on your 5 most critical assets — most plants find 30–40% of PMs are skipped or delayed. Fix the compliance gap first.
Eliminate Paper Work Orders
Plants using paper work orders lose 6–8 hours per week per technician in lost data, illegible notes, and manual data entry. Digitize work orders and capture failure codes, parts used, and root cause at the point of repair.
Set Vibration Alarm Thresholds
If you already have vibration sensors but no alerts configured, you're flying blind. Set ISO 10816 alarm thresholds on your top 3 rotating assets today — bearing failures typically show vibration signatures 2–6 weeks before catastrophic failure.
Audit Spare Parts for Top 3 Assets
Waiting for parts is the #1 cause of extended MTTR. Verify that critical spares (bearings, seals, belts, motors) for your top 3 bad actors are in stock with min/max levels set. A missing $200 bearing can cost $20,000 in downtime.
The Cost of Inaction
What Unplanned Downtime Is Really Costing Your Plant
Before you build your downtime reduction roadmap, you need to understand the number you're fighting. Use this formula to calculate your current cost of unplanned downtime — most plants are shocked by the result.
Downtime Cost Formula
Worked Example: A 180-Asset Food Processing Plant
A 30% reduction via this 90-day plan saves $1,198,920 annually — typically returning the OxMaint investment 20–40x in year one alone.
How OxMaint Helps
How OxMaint Powers Your 90-Day Downtime Reduction Plan
OxMaint's AI-powered CMMS and EAM platform gives you every tool needed to execute this 90-day plan — from bad actor identification to predictive maintenance triggers — without spreadsheets, paper work orders, or siloed data.
AI-Powered Bad Actor Detection
OxMaint automatically analyzes your work order history, MTBF, and downtime logs to rank your worst-performing assets — no manual data crunching required. Get a prioritized bad actor list in minutes, not weeks.
Predictive Maintenance Triggers
Connect vibration, temperature, and oil-analysis sensors to OxMaint. Our AI sets dynamic alarm thresholds based on your asset baselines and auto-generates work orders when anomalies are detected — before failure occurs.
Digital Work Orders with Failure Coding
Eliminate paper work orders. OxMaint's mobile app lets technicians capture failure codes, parts used, root cause, and photos at the point of repair — feeding the AI the data it needs to improve PM scheduling over time.
Maintenance Analytics & KPI Dashboards
Real-time dashboards track MTBF, MTTR, OEE, PM compliance, and downtime cost — automatically. Run your weekly 30-minute downtime review with live data, not last month's spreadsheet.
Real-World Scenario
A 180-asset automotive parts plant was spending $42,000 annually on reactive maintenance with 412 hours of unplanned downtime per year. After implementing OxMaint's 90-day plan: Phase 1 identified 7 bad actors responsible for 68% of downtime. Phase 2 deployed vibration triggers on 4 assets, catching 3 bearing failures before catastrophic failure. Phase 3 established weekly cadence with operator-led CIL routines. Result: 34% downtime reduction in 90 days, $1.36M in avoided downtime cost, and 20x ROI on OxMaint in year one.
Downtime Reduction Metrics
Key Metrics to Track During Your 90-Day Downtime Improvement Plan
What gets measured gets managed. Track these 6 KPIs weekly throughout your downtime reduction roadmap — they tell you whether your plan is working or stalling at day 45.
| KPI | What It Measures | Baseline (Typical) | 90-Day Target | Review Frequency |
|---|---|---|---|---|
| MTBF (Mean Time Between Failures) | Average time between unplanned failures on critical assets | 180–300 hrs | +25–40% | Weekly |
| MTTR (Mean Time to Repair) | Average time to restore asset after a failure occurs | 4–8 hrs | -20–30% | Weekly |
| PM Compliance Rate | % of scheduled PMs completed on time (within ±10% of due date) | 55–70% | 90%+ | Weekly |
| Unplanned Downtime Hours | Total hours of unplanned production stoppage per month | 30–50 hrs/mo | -20–40% | Weekly |
| OEE (Overall Equipment Effectiveness) | Availability × Performance × Quality on critical assets | 55–65% | +5–10 pts | Monthly |
| Planned-to-Unplanned Maintenance Ratio | Ratio of planned maintenance hours to unplanned maintenance hours | 40:60 | 70:30 | Monthly |
Why Plans Stall
Why Most Downtime Reduction Plans Stall at Day 45 — and How to Prevent It
70% of maintenance improvement initiatives lose momentum between days 30 and 60. Here's what kills them — and the fix that keeps your plant reliability plan on track through day 90 and beyond.
Day 15–25: Data Fatigue
Teams spend weeks manually pulling downtime data from spreadsheets, paper logs, and ERP systems. By week 3, the analysis isn't done and enthusiasm fades. Fix: Use OxMaint's automated bad actor reports — the data is already live in your CMMS, so Phase 1 analysis takes hours, not weeks.
Day 30–45: Quick Wins Don't Scale
Early PM adjustments show results, but without a system to sustain them, old habits return. Paper work orders get lost, PM compliance drops back to 60%. Fix: Digitize all PMs and work orders in OxMaint by day 30 — automated reminders and mobile completion lock in the gains permanently.
Day 45–60: No Visible Progress
Without real-time KPI dashboards, leadership can't see the improvement and pulls resources. The plan dies from lack of visibility. Fix: Publish OxMaint's live MTBF and downtime dashboards on a screen in the maintenance shop floor — visible progress sustains momentum.
Day 60–90: Operator Engagement Drops
Autonomous maintenance fails when operators have no easy way to report issues. Paper logs get ignored. Fix: Give operators the OxMaint mobile app — they can flag emerging issues in 30 seconds with a photo, automatically routing a work order to maintenance.
See OxMaint on your assets — book a 30-min demo
We'll walk you through the exact 90-day downtime reduction plan on your top bad actors. See how AI-powered predictive triggers, digital work orders, and live KPI dashboards can cut your unplanned downtime 30–50% in one quarter.
Frequently Asked Questions
Downtime Reduction Plan: Your Questions Answered
How much can I reduce unplanned downtime in 90 days?
A focused 90-day downtime reduction plan typically cuts unplanned downtime 20–40% on your top failure-prone assets. The biggest gains come from Phase 1 quick wins — auditing PM compliance and adjusting intervals on bad actors can deliver 10–15% reduction in the first 30 days alone, before any predictive maintenance is deployed.
What is a bad actor in maintenance and how do I identify one?
A bad actor is an asset that contributes disproportionately to unplanned downtime — typically the top 20% of assets causing 80% of losses. Identify them by ranking all assets by total downtime hours and MTBF over the past 12 months. OxMaint automates this analysis, pulling data from your work order history to generate a prioritized bad actor list in minutes. Book a demo to see it on your data.
What's the difference between preventive and predictive maintenance in a downtime plan?
Preventive maintenance (PM) is time-based or usage-based — you service an asset every 30 days or 500 hours regardless of its condition. Predictive maintenance (PdM) is condition-based — sensors monitor vibration, temperature, or oil quality, and maintenance is triggered only when the data shows an emerging failure. PdM reduces unnecessary maintenance by 25–30% while catching failures PMs would miss. Your 90-day plan should start with PM optimization in Phase 1 and add PdM triggers in Phase 2.
How do I calculate the cost of unplanned downtime at my plant?
Multiply your annual unplanned downtime hours by your total hourly downtime cost (revenue per production hour + labor cost per hour + restart cost per hour). For example, 400 downtime hours at $9,700/hour = $3.88M annual cost. Most plants underestimate this by 50% because they only count labor, not lost revenue and restart costs. OxMaint's analytics dashboard calculates this automatically from your work order data.
Can I implement this 90-day plan without buying new sensors or hardware?
Yes — Phases 1 and 3 require zero new hardware. Bad actor identification, PM optimization, digital work orders, and operator-led autonomous maintenance all run on OxMaint's CMMS platform using your existing asset data. Phase 2 (predictive triggers) benefits from sensors, but you can start with manual inspection routes and add sensors later. Start a free 14-day trial to begin Phase 1 today.
Start your 90-day downtime reduction plan today
Join the plants that cut unplanned downtime 30–50% in one quarter with OxMaint's AI-powered CMMS. Deploy digital work orders, predictive triggers, and live KPI dashboards in minutes — not months.
Free 14-day trial · No credit card



.png)


