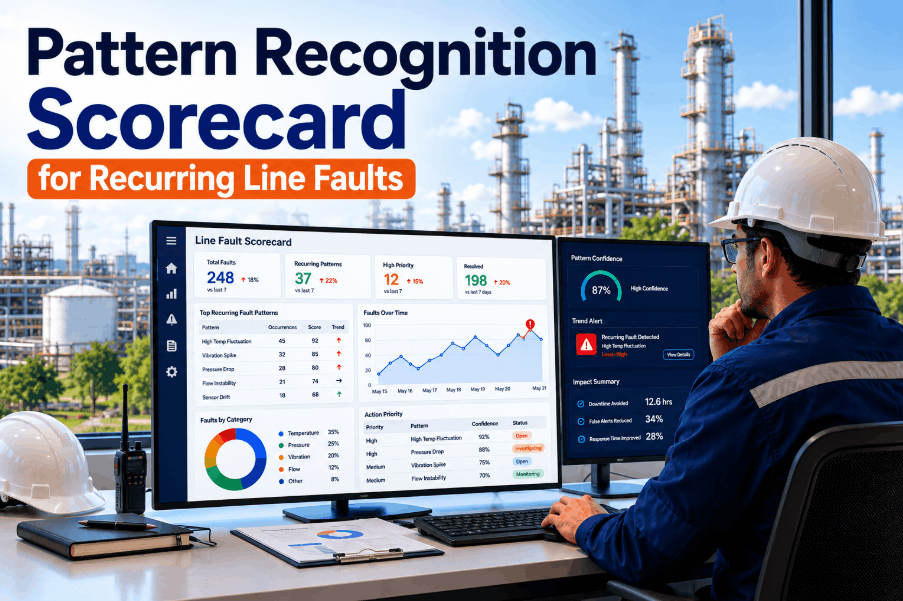
Plant managers in manufacturing face a persistent challenge: recurring equipment failures that surface in incident reports but never get resolved at the root. Without a structured reliability review scorecard, critical signals — rising mean time between failures, lengthening repair cycles, degraded predictive signal quality — stay buried in spreadsheet tabs that no one reviews before the next breakdown. A reliability scorecard consolidates those signals into a single view so plant leadership can see asset health gaps, fault pattern trends, and inspection cadence compliance at a glance. Sign Up Free to see how OxMaint's analytics and work order modules give plant managers the data infrastructure to build, populate, and review reliability scorecards without manual data assembly. Whether you're tracking MTBF across a single line or comparing fault recurrence rates across multi-site operations, the scorecard framework is the same: define the metrics, automate the capture, and review on a fixed cycle. Book a Demo to explore how OxMaint surfaces detection latency, repair cycle variance, and failure recurrence trends that plant managers need to make reliability investment decisions with confidence.
Give Plant Managers a Reliability Scorecard Powered by Real Asset Data
Failure recurrence tracking. MTBF trending. Inspection cadence compliance. Root cause closure rates. All measurable inside OxMaint.
Why Reliability Reviews Fail Without a Scorecard Structure
Most plants conduct some form of reliability review — but without a structured scorecard, those reviews degrade into incident recaps rather than trend-based decisions. These are the failure modes that scorecards are specifically designed to close.
Recurring Failures Treated as Isolated Events
Without a failure recurrence metric on a scorecard, repeat breakdowns on the same asset never get flagged as a pattern — and root cause analysis never gets triggered until downtime cost escalates beyond tolerance.
MTBF Data Lives in Disparate Systems
Mean time between failure calculations require clean work order timestamps, asset identifiers, and failure codes. When that data is fragmented across CMMS exports and manual logs, MTBF trending is too slow to influence decisions at the right cadence.
Detection Latency Is Never Measured
The gap between when a condition monitoring signal fires and when a work order is initiated is one of the highest-leverage reliability metrics — but most plants have no systematic way to capture or review it against a target threshold.
Inspection Cadence Compliance Is Assumed
Plant managers rarely have visibility into whether scheduled inspections are being completed on time until a missed inspection leads to an unplanned failure — by which point the scorecard value has already been lost.
Health Scoring Is Subjective and Inconsistent
Without a defined asset health scoring model, plant managers rely on anecdotal technician input to assess equipment condition — producing inconsistent reliability reviews that vary by shift and supervisor rather than by data.
Root Cause Closure Rates Are Not Tracked
Opening a root cause investigation without tracking whether it reaches closure and produces a corrective action creates the illusion of reliability management without delivering any reduction in fault recurrence.
The Six Metrics Every Plant Manager Reliability Scorecard Must Include
A reliability review scorecard is only as useful as the metrics it tracks. These six indicators cover the full reliability loop — from condition signal to corrective action — and together give plant managers a complete picture of asset health and program effectiveness. Book a Demo to see how OxMaint populates each of these scorecard metrics automatically from work order and inspection data.
01
Mean Time Between Failures (MTBF)
The foundational reliability metric — calculated per asset class from closed corrective work orders. OxMaint generates rolling MTBF trends from work order timestamps, allowing plant managers to spot degradation trajectories before they produce unplanned downtime events.
02
Failure Recurrence Rate
The percentage of failures on a given asset that repeat within a defined window after the previous corrective repair. A high recurrence rate signals that repairs are symptom-focused rather than root-cause-driven — and that a formal reliability investigation is overdue.
03
Detection Latency
The average time between a predictive signal or inspection finding and the initiation of a corrective work order. Reducing detection latency is one of the highest-ROI reliability levers available — and OxMaint's predictive maintenance and work order modules make this gap measurable.
04
Inspection Cadence Compliance
The percentage of scheduled condition monitoring and inspection tasks completed within the defined frequency window. OxMaint's preventive maintenance module tracks completion status and flags missed inspections before they create exposure on critical assets.
05
Asset Health Score
A composite score per asset derived from inspection findings, open work order backlog, MTBF trend, and failure recurrence — giving plant managers a single number to prioritize attention across a large asset portfolio without reviewing every work order individually.
06
Root Cause Closure Rate
The percentage of reliability investigations that reach a documented root cause finding and produce a closed corrective action within the target review cycle. OxMaint's work order and analytics modules track investigation status and surface overdue closures on the reliability dashboard.
Sign Up Free to automate root cause tracking.
Reliability Scorecard Cadence — Weekly, Monthly, and Quarterly Reviews
A scorecard is only useful if it is reviewed on a fixed cadence by the right stakeholders. Different metrics warrant different review frequencies. Sign Up Free to configure OxMaint's analytics module to generate the right reliability report for each review tier automatically.
Weekly Review
Operational reliability metrics that require fast response: open corrective work orders on critical assets, detection latency on recent predictive signals, and inspection compliance for the current week.
Audience: maintenance supervisors and reliability engineers. Purpose: prevent emerging failures from reaching the unplanned downtime threshold through rapid corrective action.
Monthly Review
Trending reliability metrics: MTBF movement per asset class, failure recurrence rate versus prior period, root cause investigation closure rate, and asset health score shifts across the portfolio.
Audience: plant managers and maintenance managers. Purpose: identify which asset classes are trending toward degraded reliability and prioritize PM strategy adjustments.
Quarterly Review
Strategic reliability performance: long-range MTBF trends, program ROI from reliability investments, capital replacement candidates identified by cumulative health scoring, and inspection program effectiveness.
Audience: plant leadership and operations directors. Purpose: validate whether the reliability program is delivering measurable uptime improvement and justify maintenance budget allocation decisions.
Reliability Scorecard KPIs — Reference Table for Plant Managers
| Scorecard Metric |
What It Measures |
Target Benchmark |
OxMaint Module |
| MTBF Trend |
Rolling mean time between failures per asset class, period over period |
Improving or stable month-over-month |
Analytics and Reporting |
| Failure Recurrence Rate |
% of failures repeating on the same asset within 90 days of prior repair |
< 10% |
Work Order Analytics |
| Detection Latency |
Avg. hours from predictive/inspection signal to work order creation |
< 24 hours on critical assets |
Predictive Maintenance |
| Inspection Cadence Compliance |
% of scheduled inspections completed within defined frequency window |
> 95% |
Preventive Maintenance |
| Asset Health Score |
Composite score per asset from inspection findings, backlog, and MTBF |
Defined per criticality tier |
Asset Management |
| Root Cause Closure Rate |
% of RCA investigations closed with documented corrective action |
> 90% within 30 days |
Work Order Management |
| Repair Cycle Time |
Avg. hours from failure work order creation to verified completion |
Defined per asset class SLA |
Work Order Analytics |
| Predictive Signal Quality |
% of predictive alerts that resulted in a confirmed failure finding on inspection |
> 70% confirmed fault rate |
Predictive Maintenance |
How OxMaint Powers the Reliability Scorecard — Step by Step
Step 1
Register Assets With Criticality Ratings and Failure Codes
OxMaint's asset hierarchy allows plant managers to assign criticality tiers and standardized fault codes to every asset. This ensures that failure recurrence and MTBF calculations are consistent across the asset portfolio from day one.
Sign Up Free to begin your asset register setup today.
↓
Step 2
Attach Timestamps and Fault Codes to Every Corrective Work Order
OxMaint's work order module captures failure start time, detection time, work order creation time, and completion time — giving the analytics engine the data points needed to calculate MTBF, detection latency, and repair cycle time automatically.
↓
Step 3
Schedule and Track Inspections in the Preventive Maintenance Module
OxMaint's PM module creates recurring inspection tasks with defined frequencies, assigned technicians, and completion tracking — populating the inspection cadence compliance metric on the reliability scorecard without manual aggregation.
↓
Step 4
Configure Root Cause Investigation Workflows
When a work order is closed with a recurring failure code, OxMaint can trigger an RCA workflow — tracking investigation status, corrective action creation, and closure against a target date. Root cause closure rate populates the scorecard automatically from this workflow.
Book a Demo to configure RCA workflows for your plant.
↓
Step 5
Review the Reliability Dashboard on a Fixed Cadence
OxMaint's analytics dashboard presents all scorecard metrics in a single view — filterable by asset class, production area, criticality tier, and time period. Plant managers can run weekly, monthly, and quarterly reliability reviews directly from the dashboard without building reports manually.
Stop Reviewing Incidents. Start Reviewing Reliability Trends.
OxMaint delivers the MTBF tracking, fault pattern analysis, inspection compliance, and root cause closure visibility plant managers need to run structured reliability reviews at every cadence.
Reliability Review Scorecards — Frequently Asked Questions
What is a reliability review scorecard for plant managers?
A reliability review scorecard is a structured set of asset health and maintenance performance metrics — such as MTBF, failure recurrence rate, and inspection compliance — that plant managers review on a fixed cadence to identify reliability gaps before they produce unplanned downtime.
What is detection latency in reliability management?
Detection latency is the time gap between when a condition monitoring signal or inspection finding is generated and when a corrective work order is initiated. Reducing this gap on critical assets is one of the most direct ways to improve asset reliability without adding inspection frequency.
How do you calculate failure recurrence rate?
Divide the number of failures on a specific asset that recur within a defined window (typically 90 days) after a prior corrective repair by the total number of failures on that asset in the period. A rate above 10% signals that repairs are not addressing the root cause.
How does a CMMS support reliability scorecard reporting?
A CMMS like OxMaint captures the work order timestamps, fault codes, inspection completion records, and RCA closure data that reliability scorecards require. Without CMMS-driven data capture, scorecard metrics must be assembled manually — making review cadences unsustainable at scale.
How often should a plant manager review the reliability scorecard?
Operational metrics like open critical work orders and detection latency warrant weekly review. Trending metrics like MTBF and failure recurrence should be reviewed monthly. Strategic program effectiveness metrics — health score movement, RCA closure rates, program ROI — are appropriate for quarterly leadership review.
What is a healthy MTBF trend for manufacturing equipment?
MTBF benchmarks vary by asset class and industry, but the scorecard target should be a stable or improving trend period-over-period rather than a fixed number. A declining MTBF on a critical asset over three consecutive months is the signal that warrants a reliability engineering review.
What is predictive signal quality and why does it appear on reliability scorecards?
Predictive signal quality measures what percentage of alerts generated by condition monitoring actually correspond to a confirmed fault on inspection. A low confirmation rate indicates over-alerting or sensor calibration issues — both of which erode technician trust in the predictive program over time.
Build Reliability Review Scorecards That Actually Drive Decisions
OxMaint combines asset health scoring, MTBF analytics, inspection compliance tracking, and root cause closure management in one CMMS built for manufacturing reliability teams.