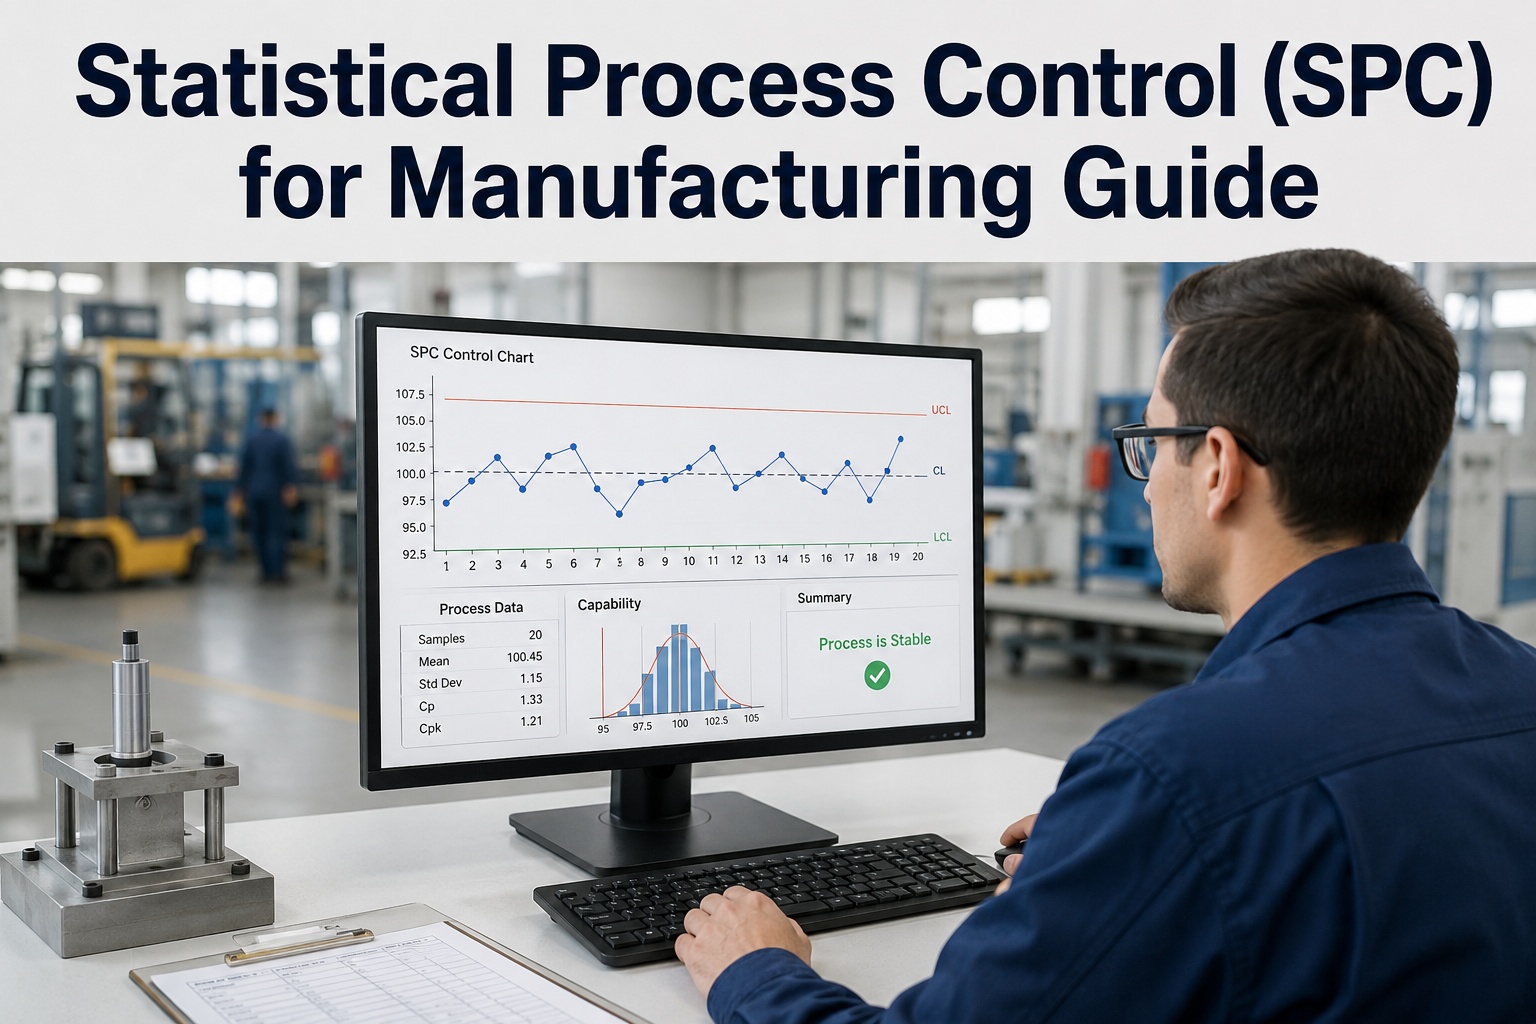
Statistical process control (SPC) is the discipline of using control charts and process capability data to catch process drift before it turns into scrap, rework, or customer complaints. In manufacturing, SPC turns quality from an after-the-fact inspection into a live, in-process signal — but only if the charts are chosen correctly, subgroups are designed well, and out-of-control signals trigger real action. This practical guide covers control chart selection, subgroup design, Cp/Cpk interpretation, out-of-control action plans, and how to build SPC into daily production meetings so it drives decisions instead of decorating a wall. If your charts exist but nobody acts on them, the fastest fix is connecting SPC signals to maintenance and process workflows — something you can test today with a Start Free Trial on OxMaint.
SPC Manufacturing Guide
Is your SPC chart driving decisions — or just hanging on the wall?
Most plants collect control chart data but never close the loop. Real SPC catches drift 2–4 hours before the first bad part, protects Cpk above 1.33, and turns quality into a daily operating rhythm.
Control Charts Manufacturing
Which SPC control chart should you use? A selection guide
Picking the wrong chart is the #1 reason SPC programs stall. Match the chart to your data type first — variables (measured) or attributes (counted) — then to subgroup size.
| Data type | Subgroup size | Chart | Typical manufacturing use |
|---|---|---|---|
| Variables (continuous) | 2–10 | X-bar & R | Shaft diameters, fill volumes, torque readings |
| Variables (continuous) | 10+ | X-bar & S | High-volume CNC dimensions, coating thickness |
| Variables (continuous) | 1 (individual) | I-MR | Batch processes, chemical concentration, low-rate lines |
| Attribute (pass/fail) | Varies | p chart | Proportion defective per lot, visual inspection results |
| Attribute (count) | Fixed area | c chart | Defects per panel, solder defects per board |
| Attribute (count/unit) | Varies | u chart | Defects per unit when sample size changes |
Rule of thumb: if you can measure it on a continuous scale, always prefer a variables chart. Variables data gives you 5–10x more statistical power per sample than pass/fail attribute data — meaning you detect drift faster with fewer parts.
SPC Implementation
How to implement SPC on the shop floor in 6 steps
A working SPC program takes 4–8 weeks to stand up if you follow a disciplined sequence. Skip a step and you end up with charts nobody trusts.
Pick 3–5 critical-to-quality characteristics
Start with the dimensions or parameters that cause the most scrap or customer escapes. Do not chart everything — focus beats coverage in the first 90 days.
Design rational subgroups
Sample 3–5 consecutive parts every 30–60 minutes so within-subgroup variation captures only common-cause noise. Mixing parts across shifts or machines in one subgroup destroys the chart's sensitivity.
Collect 20–25 subgroups for baseline limits
You need at least 20 subgroups (100+ individual readings) before control limits are statistically valid. Setting limits from 5 subgroups produces false alarms that kill operator trust.
Verify measurement system first (MSA / Gage R&R)
If measurement error exceeds 10% of total variation, your chart is measuring the gage, not the process. Run a Gage R&R study before you chart anything.
Define out-of-control action plans (OCAPs)
Every out-of-control signal needs a written response: stop the line, adjust the tool offset, call maintenance, or quarantine the last hour of production. No OCAP = no action = decorative chart.
Review charts in daily production meetings
Put yesterday's signals on the agenda of the tier-1 huddle. When operators see their chart trigger a real fix within 24 hours, they start watching the chart.
Cpk Cp Capability
Cp vs Cpk: what process capability really tells you
A process can be perfectly stable and still make scrap. Capability indices tell you whether the process spread fits inside the spec — and whether it's centered.
Cp — potential capability
Cp = (USL − LSL) / 6σ
Measures spread only. A Cp of 1.33 means the process uses 75% of the tolerance band. Says nothing about centering.
Cpk — actual capability
Cpk = min[(USL − μ)/3σ, (μ − LSL)/3σ]
Measures spread AND centering. Cpk can never exceed Cp. The gap between them is your centering opportunity.
Worked example: a machining cell holds a 25.00 ±0.05 mm bore. Cp = 1.67 but Cpk = 0.9 — the process is capable but running 0.02 mm off-center toward the upper limit. A single tool-offset correction moves Cpk to 1.6 and eliminates 2,100 ppm of scrap. That is a 5-minute fix worth $38K/year on a $4.2M part family.
SPC Quality Control
8 out-of-control signals every operator should recognize
The Western Electric and Nelson rules detect non-random patterns long before a point crosses the control limit. Catching a rule-2 violation (9 points on one side) typically gives you 2–4 hours of warning before the first reject.
1 point beyond 3σ
Classic out-of-control. Stop, investigate, check the last subgroup's parts.
9 points on one side of centerline
Process mean has shifted. Check tool wear, material lot, or setup change.
6 points steadily increasing or decreasing
Trend — usually tool wear, thermal drift, or gradual fixture loosening.
14 points alternating up/down
Over-adjustment by operators or two alternating fixtures/cavities.
2 of 3 points beyond 2σ (same side)
Early warning of a mean shift. Investigate before it hits 3σ.
4 of 5 points beyond 1σ (same side)
Small sustained shift. Often a new material lot or ambient change.
15 points within ±1σ
Stratification — subgrouping is mixing two processes, or limits are stale.
8 points beyond ±1σ (both sides)
Mixture — two different processes feeding one chart (two machines, two shifts).
See how OxMaint connects SPC signals to maintenance action
Book a 30-minute demo and we'll show you how a control-chart violation auto-creates a work order, assigns a technician, and logs the fix — so drift gets corrected before it makes scrap.
How OxMaint Helps
How OxMaint turns SPC data into fewer defects and less downtime
SPC tells you the process is drifting. OxMaint makes sure someone fixes it — and that the fix is documented, tracked, and auditable.
Auto work orders from quality signals
When a control chart flags drift, OxMaint generates a prioritized work order with the asset, the parameter, and the last 10 readings attached. Cuts response time from hours to minutes.
Predictive maintenance on drift trends
OxMaint's AI correlates SPC trend violations with asset health data to predict tool wear, bearing degradation, and fixture loosening 5–10 days before failure — cutting unplanned downtime 30–50%.
PM schedules tied to capability
Assets with declining Cpk automatically get shorter preventive maintenance intervals. When capability recovers, intervals relax — so you maintain based on evidence, not a fixed calendar.
Audit-ready quality history
Every out-of-control event, the work order it triggered, and the corrective action live in one searchable record. ISO 9001 and IATF 16949 audits go from a 2-week scramble to a same-day export.
SPC Methodology
What a working SPC program looks like at 90 days
A 180-asset plant running 3 CNC lines implemented SPC on 4 critical dimensions and connected signals to OxMaint. Here is the realistic timeline and payoff.
Baseline & MSA
Gage R&R on 4 characteristics, 20-subgroup baseline on each, first control limits calculated. Found 1 gage with 28% measurement error — replaced before charting.
Live charting + OCAPs
Operators charting every 45 minutes. 11 out-of-control events in the first month — 8 were tool wear, 2 fixture drift, 1 material lot. Each triggered an OxMaint work order.
Capability improvement
Average Cpk across the 4 characteristics rose from 1.08 to 1.41 after targeted maintenance on the two worst assets. Scrap on those lines dropped 34%.
Daily rhythm locked in
SPC review added to the tier-1 huddle (5 minutes). Quality escapes to the customer fell from 3/month to 0. Annualized savings: $186K in scrap, rework, and warranty.
Common Questions
Statistical process control FAQ
What is statistical process control in manufacturing?
SPC is a method of monitoring and controlling a manufacturing process using statistical tools — primarily control charts — to distinguish normal (common-cause) variation from abnormal (special-cause) variation. The goal is to detect and correct drift before it produces out-of-spec parts, rather than inspecting quality after the fact.
What is the difference between Cp and Cpk?
Cp measures whether the process spread fits inside the specification limits — it ignores centering. Cpk measures both spread and centering, so it is always equal to or less than Cp. A Cp of 1.67 with a Cpk of 0.9 means the process is capable but off-center, and a simple offset adjustment can recover capability.
How many subgroups do I need before setting control limits?
You need a minimum of 20–25 subgroups (typically 100+ individual measurements) collected under stable conditions before control limits are statistically reliable. Setting limits from fewer subgroups produces tight, noisy limits that trigger false alarms and erode operator trust in the chart.
What should happen when a control chart signals out-of-control?
Every signal should trigger a written out-of-control action plan (OCAP): stop or flag the process, quarantine parts since the last in-control subgroup, investigate the likely cause, and document the fix. In OxMaint, the signal auto-creates a work order so the response is tracked — Book a Demo to see that workflow live.
Can SPC work for low-volume or batch manufacturing?
Yes — use Individuals-Moving Range (I-MR) charts for batch processes or short runs where rational subgroups of 3–5 are impractical. For very short runs, consider standardized charts (Z-charts) or DNOM (deviation from nominal) charts that let you plot different part numbers on the same chart.
Stop charting drift. Start fixing it.
OxMaint connects your SPC signals to work orders, asset history, and predictive maintenance — so every out-of-control point gets a tracked, documented fix before it becomes scrap.
Free 14-day trial · No credit card