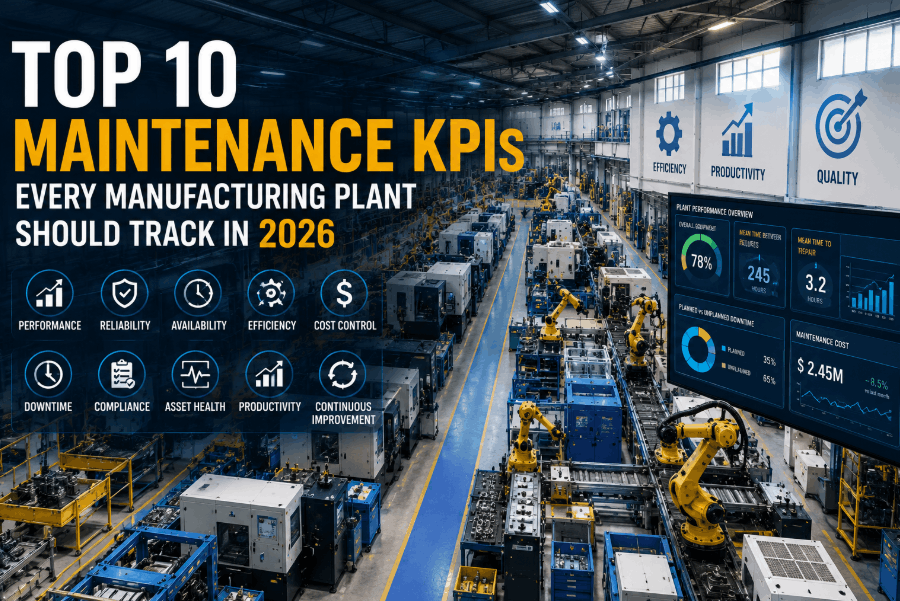
In 2026, manufacturing plants that outperform their competitors share one critical habit: they measure what matters. Maintenance KPIs for manufacturing are no longer optional reporting exercises — they are the operational backbone that separates reactive, cost-heavy plants from lean, high-reliability operations. Whether you manage a discrete assembly facility, a process plant, or a utilities operation, tracking the right maintenance performance metrics gives your team the visibility to prevent failures, cut costs, and protect production output. This guide covers the top 10 maintenance KPIs every manufacturing plant should track in 2026, complete with world-class benchmarks, formulas, and actionable improvement strategies. Sign Up Free and start tracking these KPIs today.
Track Every Maintenance KPI in One Platform. Oxmaint gives your plant the CMMS infrastructure to measure MTBF, OEE, PM compliance, wrench time, and all critical reliability KPIs — automatically, from real work order data.
Why Maintenance KPIs Are Critical for Manufacturing Plants in 2026
The manufacturing landscape has shifted. Supply chain volatility, rising asset replacement costs, and pressure to increase OEE have made reactive maintenance strategies untenable. Plants that rely on gut instinct rather than structured maintenance department metrics consistently overspend on emergency repairs, suffer unplanned downtime, and struggle to justify maintenance budgets to leadership. Book a Demo to see how Oxmaint visualizes your plant's performance indicators in real time.
Top 10 Maintenance KPIs at a Glance
A fast-reference summary of every critical maintenance KPI for manufacturing plants — formula, benchmark, and what each one tells you.
The Top 10 Maintenance KPIs Explained — Formulas, Benchmarks & Improvement Strategies
A structured breakdown of every KPI, why it matters, and what a declining trend signals. To Book a Demo and see how these metrics are tracked automatically in Oxmaint, reach out today.
01. Overall Equipment Effectiveness (OEE) — The Master Manufacturing KPI
OEE multiplies Availability, Performance, and Quality into a single score showing how effectively an asset is used. A world-class 85% means the asset is available, running at speed, and producing good output 85% of scheduled time. The industry average of 60% represents a major revenue gap — and OEE improvement almost always starts with reducing unplanned failures through a stronger PM programme.
02. Mean Time Between Failures (MTBF) — Your Reliability Barometer
MTBF shows how long an asset runs between failures. Rising MTBF means your PM strategy is working; declining MTBF on specific assets flags chronic failure candidates needing root cause analysis. Always track at the individual asset level — plant-wide averages hide the 10–15% of assets causing 70–80% of unplanned downtime. Sign Up Free to calculate MTBF automatically from your work order history.
03. Mean Time to Repair (MTTR) — Measuring Maintenance Response Efficiency
MTTR measures how quickly your team restores a failed asset. High MTTR signals parts availability gaps, skills shortfalls, or poor repair procedures. World-class operations drive MTTR down through pre-staged spare kits for critical assets, documented step-by-step procedures, and skills matrices that match qualified technicians to the right jobs.
04. Planned Maintenance Ratio (PMR) — The Single Best Indicator of Maintenance Maturity
PMR measures planned work hours versus total maintenance hours. A plant below 60% PMR is in reactive mode regardless of its schedule. Moving from 55% to 85% PMR delivers 3–5× cost savings per job — eliminating emergency labour premiums, expedited parts, and production loss costs. To Book a Demo and see PMR dashboards in action, contact the Oxmaint team.
05. PM Compliance Rate — Are Your Preventive Maintenance Jobs Actually Getting Done?
PM Compliance measures what percentage of scheduled PM work orders are completed on time. Plants below 80% compliance are accumulating undetected deterioration that eventually surfaces as unplanned failure. The root cause is almost always the same: production pressure cancelling maintenance windows, resource constraints, or overloaded scheduling.
06. Schedule Compliance — Measuring Planning and Coordination Discipline
Schedule Compliance measures whether all work orders — not just PMs — are completed on scheduled dates. It reflects planning quality and maintenance-production coordination. Top-quartile plants treat it as a shared KPI between maintenance and operations, because most deviations stem from insufficient weekly coordination — not maintenance performance alone.
07. Wrench Time — Measuring True Technician Productivity
Wrench time is the percentage of a technician's shift spent on actual hands-on work. Industry average is just 25–35% — most time is lost to travel, parts waiting, and paperwork. World-class operations reach 55–65% through pre-kitted parts, clear job plans, and digital work order management. Sign Up Free to eliminate wrench-time killers with Oxmaint's mobile platform.
08. Maintenance Backlog Ratio — Managing Work Order Pipeline Health
Backlog ratio measures weeks of open work versus available craft capacity. Below two weeks signals a reactive programme; above six weeks signals a bottleneck with jobs chronically deferred. The healthy 2–4 week range gives planners enough buffer to schedule efficiently, coordinate downtime windows, and pre-stage materials.
09. Maintenance Cost as Percentage of ARV — The Strategic Financial KPI
Maintenance spend as a percentage of asset replacement value normalises cost across facilities of different sizes, making it the most useful financial benchmark. World-class plants spend 1.5–2% ARV annually versus an industry average of 4–6% — a gap almost entirely explained by reactive work costs. Book a Demo to see how Oxmaint's cost tracking makes this benchmark measurable.
10. Equipment Availability Rate — The Direct Link Between Maintenance and Production
Equipment availability is the percentage of scheduled time an asset is ready to run. Every percentage point improvement on a critical asset translates directly into more production output with zero capital investment. World-class plants achieve 95%+ through effective PM programmes, condition monitoring, and root cause analysis that eliminates recurring failure modes.
2026 Maintenance KPI Benchmark Table — Industry Average vs World-Class
Use this reference table to assess where your plant stands against world-class maintenance benchmarks and identify your highest-leverage improvement opportunities.
| Maintenance KPI | Industry Average | World-Class Target | Declining Trend Signals |
|---|---|---|---|
| OEE | 60% | 85%+ | Increasing failures, speed losses, or quality defects |
| MTBF | Asset-specific | Trending up YoY | PM strategy ineffective; root causes unaddressed |
| MTTR | Asset-specific | Trending down YoY | Parts unavailability, skills gaps, or poor procedures |
| PMR | 55% | 85%+ | Reactive work increasing; planning discipline failing |
| PM Compliance | 60% | 95%+ | Production conflicts or resource shortfalls |
| Schedule Compliance | 60% | 90%+ | Poor coordination or planning failures |
| Wrench Time | 25–35% | 55–65% | Parts delays, poor job planning, excessive travel |
| Backlog Ratio | Variable | 2–4 weeks | Resource bottleneck or programme imbalance |
| Cost / ARV | 4–6% | 1.5–2% | Reactive culture or ageing asset deterioration |
| Availability | 80–85% | 95%+ | PM programme gaps or chronic failure assets |
How to Build a Maintenance KPI Dashboard That Drives Real Improvement
Tracking KPIs only delivers value if the data drives decisions. Here is the structured approach that world-class operations use to make every metric actionable.
Establish Your Baseline
Run three to six months of historical work order data through your CMMS. Calculate baseline values for each KPI and identify your two or three worst-performing metrics — those are your highest-leverage improvement opportunities.
Set Targets Based on Maturity Stage
Set incremental targets from your baseline — not world-class targets immediately. Moving PMR from 45% to 65% in twelve months is credible and sustainable. Targets grounded in real improvement trajectory build leadership confidence.
Review KPIs Weekly — Not Monthly
Monthly reviews create lag that allows small problems to compound. PMR, schedule compliance, PM compliance, and backlog ratio can all be reviewed in a fifteen-minute weekly meeting — creating accountability before deviations become unrecoverable.
Act on Declining Trends Immediately
Define in advance what each declining metric triggers. PMR below 70% triggers a backlog review. MTBF declining three months in a row triggers root cause analysis. Pre-defined trigger-response protocols ensure data drives action.
Stop Calculating KPIs Manually. Every KPI in this guide — PMR, MTBF, MTTR, schedule compliance, wrench time, backlog ratio — is calculated automatically in Oxmaint from your live work order data.
Maintenance KPI Questions — Answered for Manufacturing Plant Leaders
The Right Maintenance KPIs. The Right Platform. Starting Today.
Oxmaint is the CMMS built for maintenance teams who are serious about reliability. Track all ten KPIs automatically, run your PM programme, and get your team working from one mobile-accessible platform — without enterprise complexity or enterprise pricing.