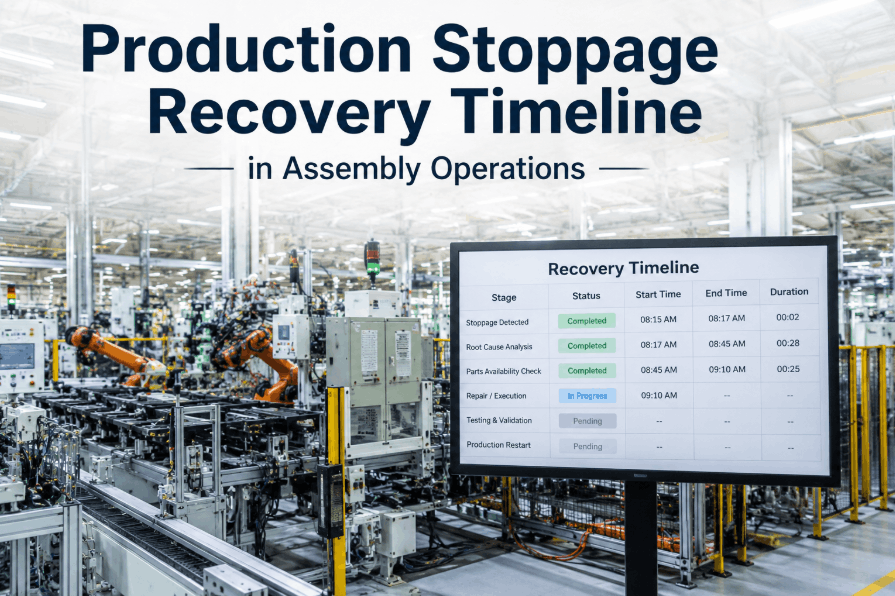
In assembly operations, production stoppages are inevitable—but the time it takes to recover is not. The recovery timeline, from the moment a line stops to when stable output resumes, is determined entirely by how fast maintenance teams can identify the fault, clear blockers, deploy the right technician and parts, execute the repair, and verify the line is stable. Sign Up Free with Oxmaint to structure your stoppage response workflows, track recovery timelines by fault type, and identify exactly where your team loses minutes or hours between fault detection and line restart. Book a Demo to see how assembly operations teams use Oxmaint to compress recovery timelines and reduce mean time to repair (MTTR) by 30–60%. This guide gives plant managers, maintenance supervisors, and reliability engineers a practical framework to map the full recovery timeline, eliminate common blockers, and build a repeatable system for faster, more predictable line restarts.
How the Recovery Timeline Determines Production Loss in Assembly Operations
Most assembly operations focus on preventing stoppages, but the financial impact of any given stoppage is driven primarily by recovery time—not the fault itself. A 15-minute mechanical fault with a 4-hour recovery timeline costs 16x more in lost production than the same fault with a 15-minute recovery. The recovery timeline has four distinct phases: detection and alert, fault diagnosis, blocker clearance (parts, permits, technician availability), and repair execution with output stabilization. Each phase has predictable waste points that compound into 30–120 minutes of avoidable delay per event. Sign Up Free to track recovery timelines per stoppage event in Oxmaint and identify your highest-impact waste points. Plants that map and optimize all four phases reduce MTTR by 30–60% and decrease production loss per stoppage by 40–70%.
Common Blockers That Extend Recovery Timelines in Assembly Operations
The majority of recovery timeline waste is caused by a predictable set of organizational and workflow blockers—not by the technical complexity of the fault itself. Book a Demo to see how Oxmaint eliminates each of these blockers through structured work order workflows and real-time technician dispatch.
Technicians arrive at the fault location without prior fault history, previous repair notes, or equipment documentation. Re-diagnosing a known recurring fault from scratch adds 20–60 minutes per event. Structured fault history access in CMMS eliminates this delay entirely.
Repair execution stalls when required parts are not in storeroom or location is unknown. Parts-related blockers account for 25–40% of total recovery time in facilities without structured critical spare inventory tied to CMMS work orders.
Without automated notification and dispatch, technicians are located manually—through radio calls, supervisor search, or shift log review. Dispatch lag adds 10–30 minutes to every unplanned stoppage response, compounding with diagnosis delay.
Lockout/tagout procedures, work permits, and safety authorization add 15–45 minutes when paperwork is completed manually at the time of the event. Pre-staged permit templates and digital work order approval compress this phase to under 10 minutes.
Lines restart but do not reach stable output due to quality deviations or secondary faults undetected during repair. Re-stopping after a failed restart adds the full detection-to-diagnosis delay again. Structured restart verification checklists reduce failed restart rate 60–80%.
Technicians responding to a stoppage are pulled from active repair backlog work with no re-prioritization. Backlog interference extends both the stoppage recovery timeline and the backlog burn-down rate—creating a compounding reliability debt across consecutive shifts.
Recovery Timeline Phases: Tasks, Time Targets, and MTTR Impact
Mapping each recovery phase with time targets and structured tasks converts a chaotic reactive process into a predictable, improvable workflow.
| Recovery Phase | Common Time Waste | Structured Task | Time Target | MTTR Impact |
|---|---|---|---|---|
| Detection and Alert | Manual fault identification, no automated alert | Automated stoppage alert from PLC or sensor integrated with CMMS work order creation | < 2 Minutes | Eliminates 5–20 min detection delay; ensures immediate technician notification |
| Fault Diagnosis | No prior fault history, manual equipment search | Technician accesses asset fault history, last repair notes, and equipment documentation via CMMS mobile | < 10 Minutes | Reduces diagnosis time 40–60% for recurring faults |
| Parts and Resource Verification | Parts unavailable or location unknown | Work order links to storeroom inventory; auto-reserve parts on work order creation for critical assets | < 5 Minutes | Eliminates 25–40% of stoppage duration caused by parts search and sourcing |
| Technician Dispatch | Manual radio search, supervisor coordination | Automated mobile notification to assigned technician; escalation if no acknowledgment in 5 minutes | < 5 Minutes | Removes 10–30 min dispatch lag per event |
| Repair Execution | Unclear repair steps, missing tools | Step-by-step repair instructions with required tools listed in work order; digital sign-off per step | Fault-dependent | Reduces repair time variability 20–35%; prevents missed steps that cause re-stoppages |
| Restart Verification | Premature restart without output quality check | Structured restart checklist in CMMS with supervisor approval before line restart flag is cleared | < 10 Minutes | Reduces failed restart rate 60–80%; prevents secondary stoppage within same shift |
| Output Stabilization | Quality deviations missed, throughput not confirmed | 30-minute post-restart monitoring period with throughput and quality confirmation before work order closure | 30 Minutes | Confirms stable production; prevents premature closure that masks secondary faults |
Building a Faster Recovery Timeline Program with Oxmaint CMMS
Assembly operations teams that consistently achieve short recovery timelines build structured response workflows into their CMMS before stoppages occur—not during them. Pre-staged work orders, linked fault history, and automated dispatch eliminate the planning waste that dominates most recovery timelines. Book a Demo to see how Oxmaint structures the full recovery workflow from alert to output stabilization for assembly line environments.
- Log the last 20–30 stoppages and break actual recovery time into each phase: detection, diagnosis, parts, dispatch, repair, restart
- Identify which phase accounts for the most wasted time across your highest-frequency fault types
- Prioritize workflow fixes for the top 3 fault types that drive 60–70% of total stoppage duration
- Create pre-staged work order templates in Oxmaint for every fault type occurring more than once per quarter
- Link each template to the required parts, tools, and repair instructions so technicians can begin immediately on dispatch
- Reserve critical spare parts in the storeroom and link to specific asset work orders for instant allocation
- Configure Oxmaint to auto-dispatch the nearest available qualified technician when a stoppage work order is created
- Set escalation rules: if no acknowledgment in 5 minutes, notify supervisor; if no dispatch in 10 minutes, escalate to lead
- Track dispatch-to-arrival time as a KPI and set improvement targets quarterly
- Create restart checklists in work orders requiring confirmation of quality, throughput, and secondary system checks before closure
- Track MTTR per fault type, per asset, and per shift—use trends to identify systematic gaps in specific phases
- Review top 5 longest recovery events monthly and assign root cause elimination tasks to prevent recurrence
Recovery Timeline Best Practices: Common Patterns and Quick Wins
Production Stoppage Recovery KPIs for Assembly Operations
Assembly teams that track recovery timeline KPIs systematically reduce MTTR and production loss per event over time—turning a reactive process into a continuously improving reliability program. Sign Up Free to access Oxmaint's stoppage recovery and MTTR dashboards built for assembly manufacturing environments.
Average time from stoppage detection to stable output restoration. The primary recovery timeline metric. Reducing MTTR 30% annually requires systematic waste elimination in each recovery phase, not individual heroics.
Time from stoppage work order creation to technician arrival at the fault location. Above 10 minutes indicates dispatch workflow failure. Automated mobile dispatch notification reduces this to under 5 minutes in most facilities.
Percentage of line restarts that result in a re-stoppage within 30 minutes. Above 15% signals inadequate repair verification. Structured restart checklists with supervisor sign-off reduce failed restart rate to under 5%.
Percentage of stoppage repairs where required parts were available in the storeroom without sourcing delay. Below 75% indicates critical spare inventory gaps. Pre-staged parts linked to high-frequency fault templates drive this metric above 90%.
Frequency of same fault type recurring on the same asset within 30 days. High recurrence indicates root cause not addressed at repair. Root cause fields in work order closure and follow-up task creation are the primary drivers of improvement.
Standard deviation of recovery time for the same fault type across events. High variability signals undocumented procedures or technician-dependent responses. Pre-staged work order templates and structured repair instructions reduce variability 30–50%.