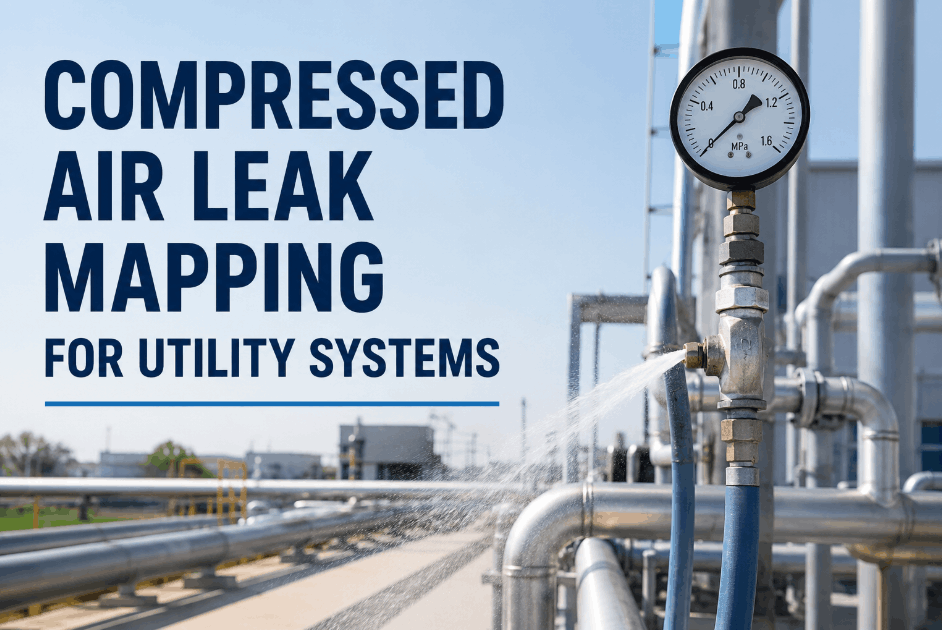
Energy waste in shared utility systems accumulates without triggering alarms — compressed air leaks, steam trap failures, and idle electrical loads during non-production periods compound into measurable cost and carbon signal problems that only become visible at billing review or sustainability audit. A multi-building industrial facility managing compressed air, steam, and electrical utility infrastructure across production and support buildings found itself with a persistent energy management gap: consumption data existed at the meter level but could not be broken down by system or area, leak detection relied on scheduled walk-throughs rather than continuous monitoring, and there was no connection between maintenance activity and utility performance outcomes. If your operation is managing shared utility systems with disconnected consumption data and no structured waste detection process, Sign Up Free to see how Oxmaint connects utility visibility to maintenance operations — or Book a Demo with an energy operations specialist.
Energy Waste · Utility Mapping · Consumption Control
Connect Utility System Visibility to Maintenance Operations Before Waste Compounds Into a Reporting Problem
System-level consumption mapping, compressed air and steam loss tracking, idle load baseline monitoring, demand profile analysis, and maintenance-linked utility performance — Oxmaint helps industrial facilities lower energy waste in shared systems without new metering infrastructure.
Facility Profile
The Operation: Shared Utility Infrastructure, Unquantified System Losses, and No Consumption-to-Maintenance Link
Facility Overview
IndustryIndustrial manufacturing — multi-building campus with shared compressed air, steam, and electrical utility systems
Utility SystemsCompressed air distribution, steam network, electrical load across 4 production and 2 support buildings
Team14 utility and maintenance personnel, 1 energy coordinator, 2 operations supervisors
Prior SystemMeter-level billing data, manual leak log, no system-level consumption mapping or load monitoring
Oxmaint FeaturesUtility Mapping · Energy Data Tracking · Consumption Control · Leak Detection Workflow · Load Behavior Monitoring · Demand Profile Analysis · Carbon Signal Reporting · Sustainability Data Integration
Baseline Pressure Points
34%
Of estimated utility cost variance traced to unquantified system losses — compressed air, steam, and idle electrical loads operating without structured oversight
2.7×
Time required to assemble consumption data for sustainability review versus target — data was scattered across billing records and manual inspection logs
42%
Of compressed air leak events were identified reactively — reported by operators following pressure drops rather than detected through structured monitoring rounds
Root Cause Analysis
Why Energy Waste Kept Accumulating — And Why Utility Losses Stayed Below Visibility Thresholds
A structured review of 90 days of utility billing data, maintenance logs, and sustainability reporting identified four operational gaps sustaining energy waste persistence at the facility. Metering infrastructure was in place and billing data was available — the problem was operational structure. Consumption was not mapped below the billing-point level, load behavior during non-production periods was invisible, system losses were not tracked between inspections, and the energy impact of maintenance activity could not be measured. Sign Up Free to map your own utility waste exposure — or Book a Demo to see how Oxmaint applies consumption visibility to shared utility systems.
36%
No System-Level Consumption Mapping — Data Existed Only at Billing-Point Meter Level
Utility data was available at the building or billing-point level but could not be disaggregated by system or production area. Supervisors had no way to identify which systems were consuming disproportionately or trending upward between billing cycles — making early intervention on energy drift impossible.
28%
Compressed Air and Steam Losses Not Tracked Between Scheduled Inspections
Leak identification relied on quarterly walk-through inspections. Between inspections, compressed air losses accumulated without detection. Steam trap performance was not continuously monitored, and failed traps were typically discovered through elevated steam bills rather than through proactive system monitoring.
22%
Idle Load Behavior Not Visible Across Shared Electrical Systems
Electrical consumption patterns during non-production periods — nights, weekends, and planned shutdowns — were not tracked at the system level. Idle loads operating above expected baseline remained invisible until aggregate billing indicated elevated consumption without a clear identifiable source.
14%
No Link Between Maintenance Activity and Utility Performance Outcomes
Work orders for utility-adjacent assets — compressors, steam traps, HVAC, pumps — were not connected to consumption data. The energy impact of completed maintenance could not be measured, and decisions about maintenance prioritization could not be informed by utility performance information.
The Solution
How Oxmaint Reduced Energy Waste Across Shared Utility Systems at the Facility
The facility deployed Oxmaint without replacing existing metering infrastructure or restructuring its utility team. The platform layered structured consumption visibility and maintenance linkage over existing utility data — mapping consumption by system and area, converting inspection rounds into structured recurring maintenance tasks with logged findings, and connecting work order completion to utility performance tracking. Idle load profiles were established as baselines so anomalous consumption during non-production periods could be identified and investigated before accumulating into significant cost variance. Steam trap inspections and compressed air surveys were structured as scheduled tasks with findings logged against specific system nodes rather than captured in unstructured manual logs. Book a Demo to see how Oxmaint brings structured utility waste visibility to shared infrastructure operations.
01
System-Level Consumption Mapping Across All Utility Networks
Utility consumption was mapped by system and production area within Oxmaint, giving energy coordinators and supervisors visibility into which systems were consuming disproportionately. Trending data allowed comparison across production periods — identifying systems where consumption was drifting upward well ahead of billing-cycle discovery and enabling proactive corrective action.
02
Structured Leak Detection and Loss Logging as Recurring Maintenance Tasks
Compressed air surveys and steam trap inspections were converted from informal quarterly walk-throughs into structured recurring maintenance tasks in Oxmaint, with findings logged against specific system nodes. Leak events were tracked from detection through repair, and cumulative loss data by system was available for prioritization and sustainability reporting without manual data assembly.
03
Idle Load Baseline Monitoring During Non-Production Periods
Consumption baselines were established in Oxmaint for each shared system during non-production periods. Deviations from baseline during nights, weekends, or planned shutdowns were flagged for investigation — allowing idle load anomalies to be identified and resolved within 48 hours rather than waiting for the next billing cycle to surface elevated aggregate consumption.
04
Maintenance-to-Utility Linkage for Energy Performance Outcome Tracking
Work orders for utility-adjacent assets were linked to consumption data in Oxmaint, enabling supervisors to measure energy performance before and after maintenance activity. Prioritization decisions for compressors, steam traps, and HVAC systems could be informed by quantified utility impact rather than schedule adherence alone — directing maintenance effort toward the highest waste-reduction return.
Results at 90 Days
What Energy Waste Numbers Looked Like Three Months After Deployment
61%
Reduction in unquantified utility system losses — compressed air, steam, and idle electrical load waste identified and addressed
88%
Of compressed air leak events now identified proactively through structured rounds — up from 58% reactive detection at baseline
74%
Faster sustainability data assembly — from 2.7× to 0.7× target time for utility consumption reporting
+44%
Increase in utility-adjacent work orders linked to consumption performance data at execution
100%
System-level consumption visibility coverage — previously unavailable below building meter level
3.5×
ROI on platform cost within 90 days from reduced utility waste and eliminated emergency leak response costs
| Metric |
Before Oxmaint |
90 Days After |
Change |
| Unquantified utility system losses |
34% of cost variance |
Under 13% |
-61% |
| Compressed air leaks detected proactively |
58% reactive |
88% proactive |
+52% |
| Sustainability data assembly time |
2.7× target |
0.7× target |
-74% |
| Work orders linked to utility performance |
~8% |
52% |
+44% |
| System-level consumption visibility |
Meter level only |
Full system mapping |
Full coverage |
| Idle load anomaly detection time |
Billing cycle (~30 days) |
Within 48 hours |
-93% |
Key Business Impact
What Closing Utility Waste Visibility Gaps Means for Shared Infrastructure Operations
"The utility programs that consistently underperform on energy efficiency share a common structural problem: the data exists at the meter, but nobody has mapped it to the systems and activities that actually drive consumption. Compressed air leaks get fixed when operators notice pressure drops, not when they start. Steam trap failures show up in the monthly bill, not in a maintenance alert. Idle loads during shutdowns go unnoticed until someone runs a manual comparison. The result is energy waste that is entirely preventable but invisible under the current operational structure. Connecting utility data to maintenance workflows — making leak detection a scheduled task, linking work orders to consumption outcomes, monitoring idle loads against a baseline — does not require new metering infrastructure. It requires making energy visibility part of how maintenance operates. When that happens, waste reduction becomes an operational outcome, not just a sustainability target."
Elena Vasquez, Utility Operations and Industrial Energy Efficiency Advisor
15 years industrial utility and energy management · Former energy systems manager, multi-site manufacturing campus · Specialist in compressed air programs, steam system optimization, and maintenance-integrated energy waste reduction
Utility Visibility · Waste Reduction · Sustainability Data
Replace Reactive Utility Management With Consumption-Aware Maintenance Operations
System-level consumption mapping, structured leak detection workflows, idle load baseline monitoring, and maintenance-to-utility performance linkage — Oxmaint gives facilities the operational structure to lower energy waste in shared systems without additional headcount or new metering hardware.
FAQs
Frequently Asked Questions
How does Oxmaint reduce energy waste in shared utility systems?
Oxmaint maps consumption by system and area, structures leak detection and loss logging as recurring maintenance tasks, and monitors idle load baselines — making energy waste visible and addressable through normal maintenance operations rather than reactive billing review.
Can Oxmaint track compressed air leaks and steam losses within maintenance workflows?
Yes. Compressed air surveys and steam trap inspections are structured as recurring maintenance tasks in Oxmaint, with findings logged against specific system nodes and tracked from detection through repair completion.
Does Oxmaint connect maintenance work orders to utility consumption data?
Yes. Work orders for utility-adjacent assets are linked to consumption tracking in Oxmaint — allowing supervisors to measure energy performance before and after maintenance and prioritize work based on quantified utility impact.
How does Oxmaint support sustainability and carbon reporting for utility systems?
Consumption data mapped by system and period in Oxmaint provides structured input for sustainability reviews and carbon signal reporting — reducing manual data assembly time and improving energy performance reporting accuracy.
How quickly does utility waste visibility improve after deploying Oxmaint?
System-level consumption mapping is typically available within the first billing cycle after configuration. Proactive leak detection and idle load anomaly alerts are measurable within the first 30 days of deployment.
Every Waste Point Identified Is an Efficiency Gain Captured
Give Your Utility Operations the Consumption Visibility Structure It Needs
Oxmaint brings system-level utility mapping, structured loss detection, idle load monitoring, and maintenance-linked consumption tracking to shared infrastructure operations — with no new metering hardware required.