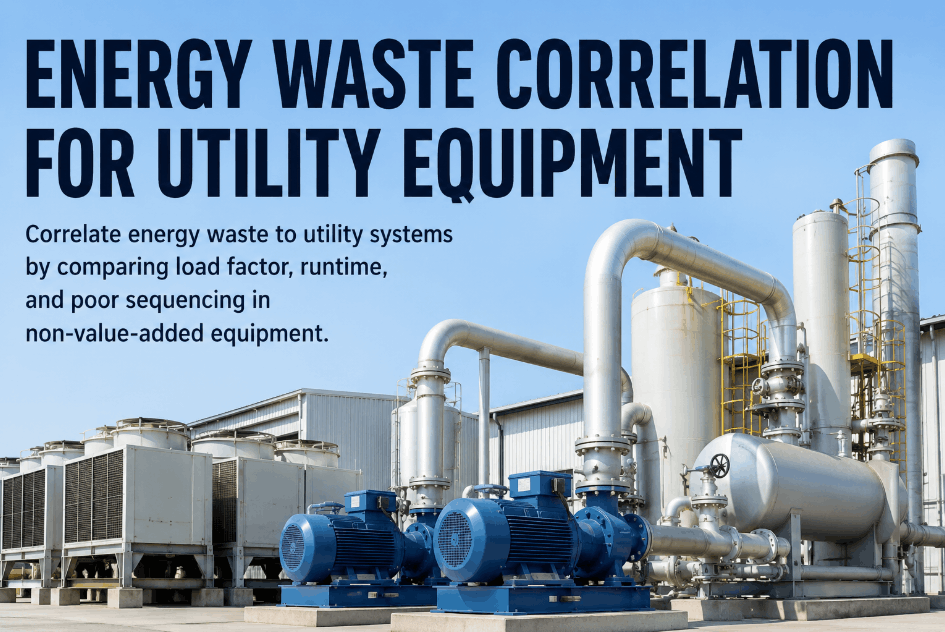
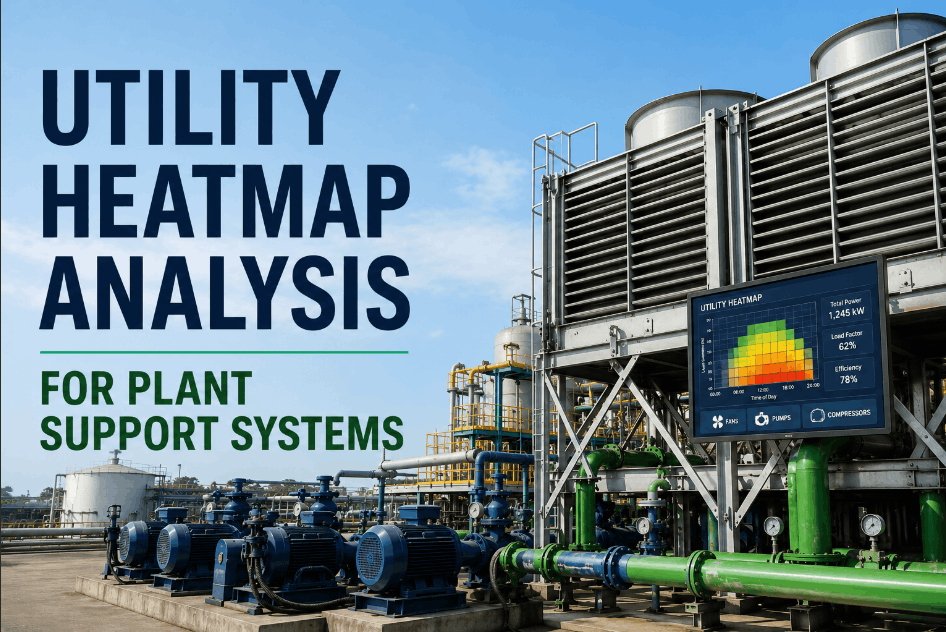
Plant support systems — HVAC, compressed air, cooling towers, lighting, pumping stations — quietly consume a disproportionate share of your facility's total energy budget. Unlike production equipment, these systems rarely get the scrutiny they deserve. Without structured energy consumption benchmarks, maintenance teams have no baseline to measure against, no trigger for action, and no visibility into where idle load is bleeding into operating waste. You can Sign Up Free and start benchmarking your plant support systems against real operational data within days. This guide covers how to establish utility demand baselines, identify idle load anomalies, and use condition trend data to make confident replacement and renewal decisions before waste becomes failure.
Why Energy Consumption Benchmarks Matter for Plant Support Assets
Most plant managers know their production energy costs in detail but cannot answer basic questions about support system consumption — how much compressed air is lost to leakage, what the baseline kWh draw of a cooling tower should be at 70% load, or when a pump's rising current signals an impending seal failure. Book a Demo to see how Oxmaint maps utility demand benchmarks directly to your asset registry and maintenance workflows. Benchmarking closes this blind spot: it turns energy readings into condition signals that maintenance teams can act on through structured work orders, not informal observation.
Establish normal operating demand ranges per support system per production mode. Deviations from baseline become automatic maintenance triggers — not manual discoveries.
Track energy draw during non-production hours across HVAC, compressed air, and pumping assets. Idle load above benchmark signals control failures, leakage, or standby inefficiency worth investigating.
Compare actual consumption against benchmark envelopes to surface operating waste — degraded insulation, blocked filters, worn impellers — that silently inflates energy costs over months.
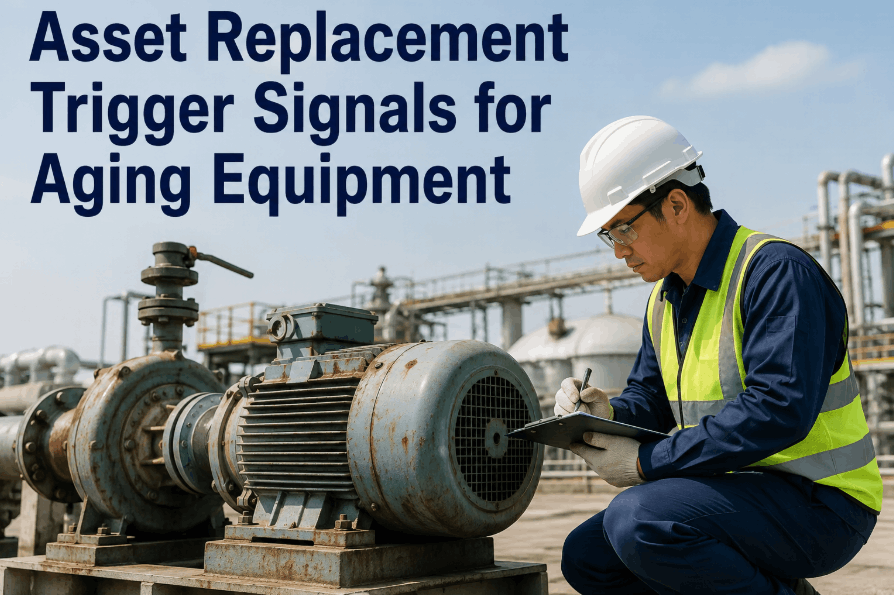
Energy trend data reveals when a support asset is approaching end-of-efficient life. Rising consumption at constant load is a quantified renewal trigger that justifies capital planning decisions.
Oxmaint links energy performance history to each asset's service record, giving maintenance planners a consumption-linked view of remaining useful life alongside traditional age and cycle data.
Instead of static threshold alarms, Oxmaint evaluates energy consumption trends against rolling benchmarks — catching gradual degradation patterns that fixed thresholds routinely miss.
Energy Benchmark Framework: Support System Categories and Monitoring Priorities
Not all plant support systems carry the same energy risk profile. A compressed air system with a 15% leak rate has a materially different financial impact than an over-lit storage area. Effective benchmarking requires prioritization — focusing active monitoring effort on the support systems where consumption anomalies translate directly into maintenance action and cost avoidance. Sign Up Free and connect your first support system asset class to see consumption trend scoring in action.
| Support System | Benchmark Metric | Monitoring Priority | Idle Load Signal | Renewal Trigger | Work Order Type |
|---|---|---|---|---|---|
| Compressed Air | kWh per Nm³ delivered | Critical | Compressor running unloaded | 10%+ efficiency drop | Immediate |
| HVAC / Chilled Water | kW per ton of cooling | High | Compressor cycling at low load | COP below design 15% | Scheduled PM |
| Cooling Towers | kWh per unit heat rejected | High | Fan running at off-hours | Approach temp rising | Condition-based |
| Pumping Stations | kWh per m³ pumped | High | Pump running against closed valve | Wire-to-water eff. -12% | Immediate |
| Industrial Lighting | W per lux per m² | Medium | Zones lit during non-production | Fixture lumen decay | Scheduled review |
| Ventilation / Exhaust | kWh per m³/h air moved | Medium | Fan at full speed during idle | Static pressure rising | Condition-based |
| Steam / Hot Water | BTU per unit output | Medium | Boiler firing at partial load | Trap failure rate rising | Scheduled PM |
| Water Treatment | kWh per m³ processed | Low–Medium | Backwash running off-cycle | Membrane rejection drop | Manual review |
How Oxmaint AI Turns Energy Benchmarks Into Predictive Maintenance Workflows
Energy data without an action path is just a report. Oxmaint closes the loop between consumption benchmarks and maintenance execution — using anomaly detection and work order automation to turn a rising kWh trend into a dispatched technician before the equipment fails. Book a Demo to see a live walkthrough of an energy threshold firing through to mobile technician dispatch in your plant environment.
Oxmaint ingests historical energy data for each support asset to establish normal consumption envelopes across production modes, seasons, and load conditions — the reference every future reading is evaluated against.
Energy readings during non-production windows are continuously compared against idle benchmarks. Anomalous idle load — a pump running when no process demand exists — triggers a prioritized inspection work order automatically.
Rather than waiting for a hard threshold breach, Oxmaint tracks the rate of change in consumption efficiency. A compressor consuming 3% more energy per Nm³ each month will generate a predictive alert weeks before any alarm limit is crossed.
Oxmaint links energy performance history to each asset's depreciation record and replacement cost, producing a risk-ranked asset roadmap that prioritizes capital renewal decisions based on consumption-linked lifecycle cost, not age alone.
When a consumption anomaly or trend alert fires, Oxmaint creates a fully populated work order — asset record, energy trend data, recommended corrective action — and routes it to the assigned technician on mobile within minutes of detection.
Building a Risk-Ranked Asset Roadmap from Energy Benchmark Data
Capital planning for plant support systems should be driven by quantified consumption risk, not equipment age. Oxmaint combines energy performance trends, service life records, and criticality scores to produce a prioritized asset roadmap that helps maintenance managers defend renewal budgets with data. Sign Up Free and connect your support asset register to see consumption-linked risk ranking in your first session.