Ask most reliability engineers to name their plant's top ten worst assets and they can usually rattle off the answer from memory — the same pumps, fans, and feeders that show up on every breakdown report. But naming a bad actor from memory and proving it with data are two different things, and proving it is what gets budget approved for a permanent fix. Across power plants, roughly ten percent of equipment is typically responsible for sixty to eighty percent of total maintenance spend, yet that figure usually sits buried across work order exports, paper logs, and spreadsheets that go stale the moment they're built. A bad actor dashboard pulls failure frequency, repair cost, and downtime directly from work order history and ranks every asset automatically. OxMaint's reliability dashboard gives engineers that ranking without a single pivot table.
Reliability Engineering
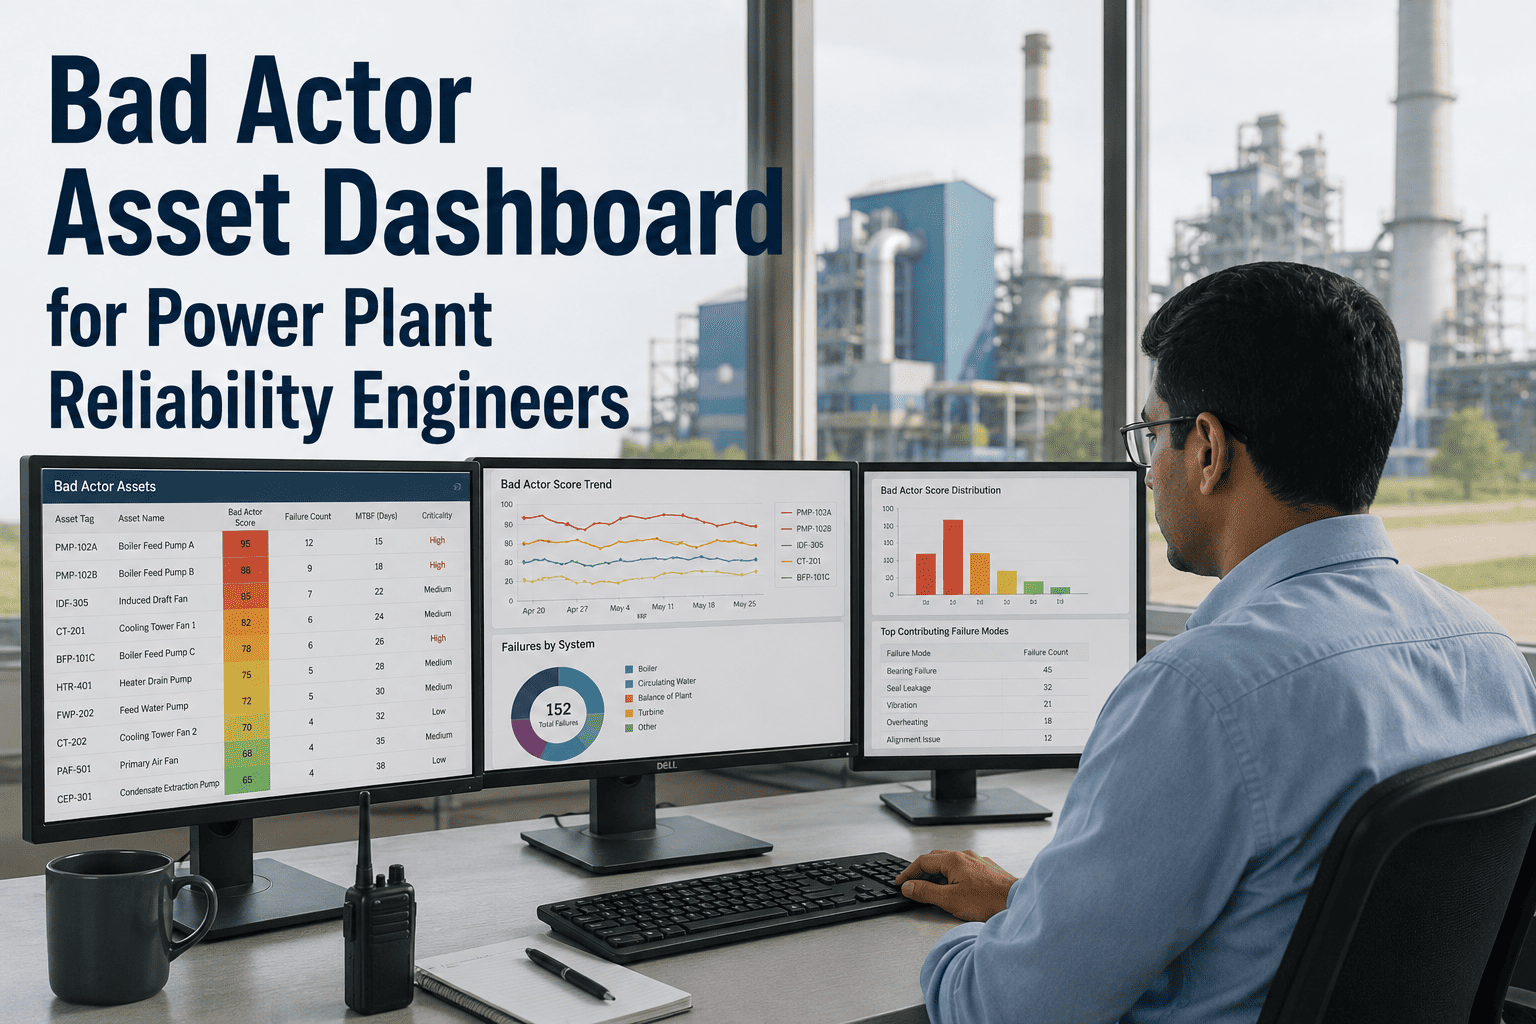
Know Your Worst Assets Without Building a Spreadsheet
A live bad actor dashboard that ranks assets by cost, failure frequency, and downtime — straight from your work order history.
The 10/80 Reality of Plant Maintenance Spend
A small fraction of assets drives the overwhelming majority of unplanned cost. Until that fraction is visible, every asset gets the same level of attention — including the ones that don't need it.
~10% of assets — repeat failures, chronic bad actors
~65% of maintenance spend — driven by that 10%
The remaining 90% of assets share the rest of the spend
Six KPIs Every Reliability Engineer Watches
MTBF
Mean time between failures per asset — a falling trend is the earliest signal of a developing bad actor.
MTTR
Mean time to repair — rising repair times often point to recurring parts shortages or unclear procedures.
Unplanned Cost Share
The portion of an asset's total maintenance cost that came from unplanned, reactive work orders.
Failure Frequency
Number of failures per asset within a rolling window, the core metric behind the bad actor threshold.
Forced Outage Rate
How often an asset's failure directly causes an unplanned generation loss, not just a maintenance event.
Failure Mode Mix
Breakdown of failure causes per asset — bearing, seal, electrical — showing where engineering effort should focus.
Turn Work Order History Into a One-Click Pareto Report
Building a bad actor ranking by hand means exporting work orders, cleaning failure codes, and rebuilding the chart every quarter. OxMaint generates the ranking continuously from live data, with every asset linked back to its full failure history.
What the Dashboard Lets a Reliability Engineer Do
01
Rank Assets Automatically by Cost and Frequency
Every asset is ranked by total cost of unreliability — repair cost plus downtime impact — updated as new work orders close, with no manual data pull required.
02
Drill Into Failure History Per Asset
Selecting any asset opens its full work order history, failure mode tags, and prior RCA findings, so engineers can see the pattern behind the ranking.
03
Track MTBF Trends Over Time
A declining MTBF trend on an asset flags it before it formally crosses the bad actor threshold, giving engineers a head start.
04
Filter by Unit, System, or Time Period
Rankings can be scoped to a single unit, a process area, or the full plant, and compared across time periods to confirm whether a fix actually worked.
Frequently Asked Questions
What data does the bad actor dashboard need to work?
It relies on work orders being logged against the correct asset with cost, downtime, and failure mode recorded.
OxMaint enforces this at the point of work order closure, so the dashboard stays accurate without a separate cleanup step.
How often is the bad actor ranking updated?
The ranking recalculates continuously as work orders close, so the dashboard always reflects the most recent failure and cost data rather than a static monthly snapshot.
Can the dashboard show whether a previous fix actually worked?
Yes — by comparing an asset's MTBF and failure frequency before and after a corrective action, the dashboard shows whether the fix held or whether the asset returns to the bad actor list.
Book a demo to see this comparison view.
Is the dashboard useful for plants with limited maintenance history?
Even a few months of consistently logged work orders is enough to surface the most obvious bad actors, and the ranking becomes more precise as more history accumulates.
Can multiple reliability engineers use the dashboard across different units?
Yes — rankings can be filtered by unit or system so each engineer sees the assets relevant to their area, while plant leadership can view the consolidated ranking across all units.
Stop Guessing Which Assets Need Engineering Attention
OxMaint turns your existing work order history into a live, ranked view of your worst assets — so reliability engineering effort goes where it actually matters. Start a free trial or book a 30-minute walkthrough.