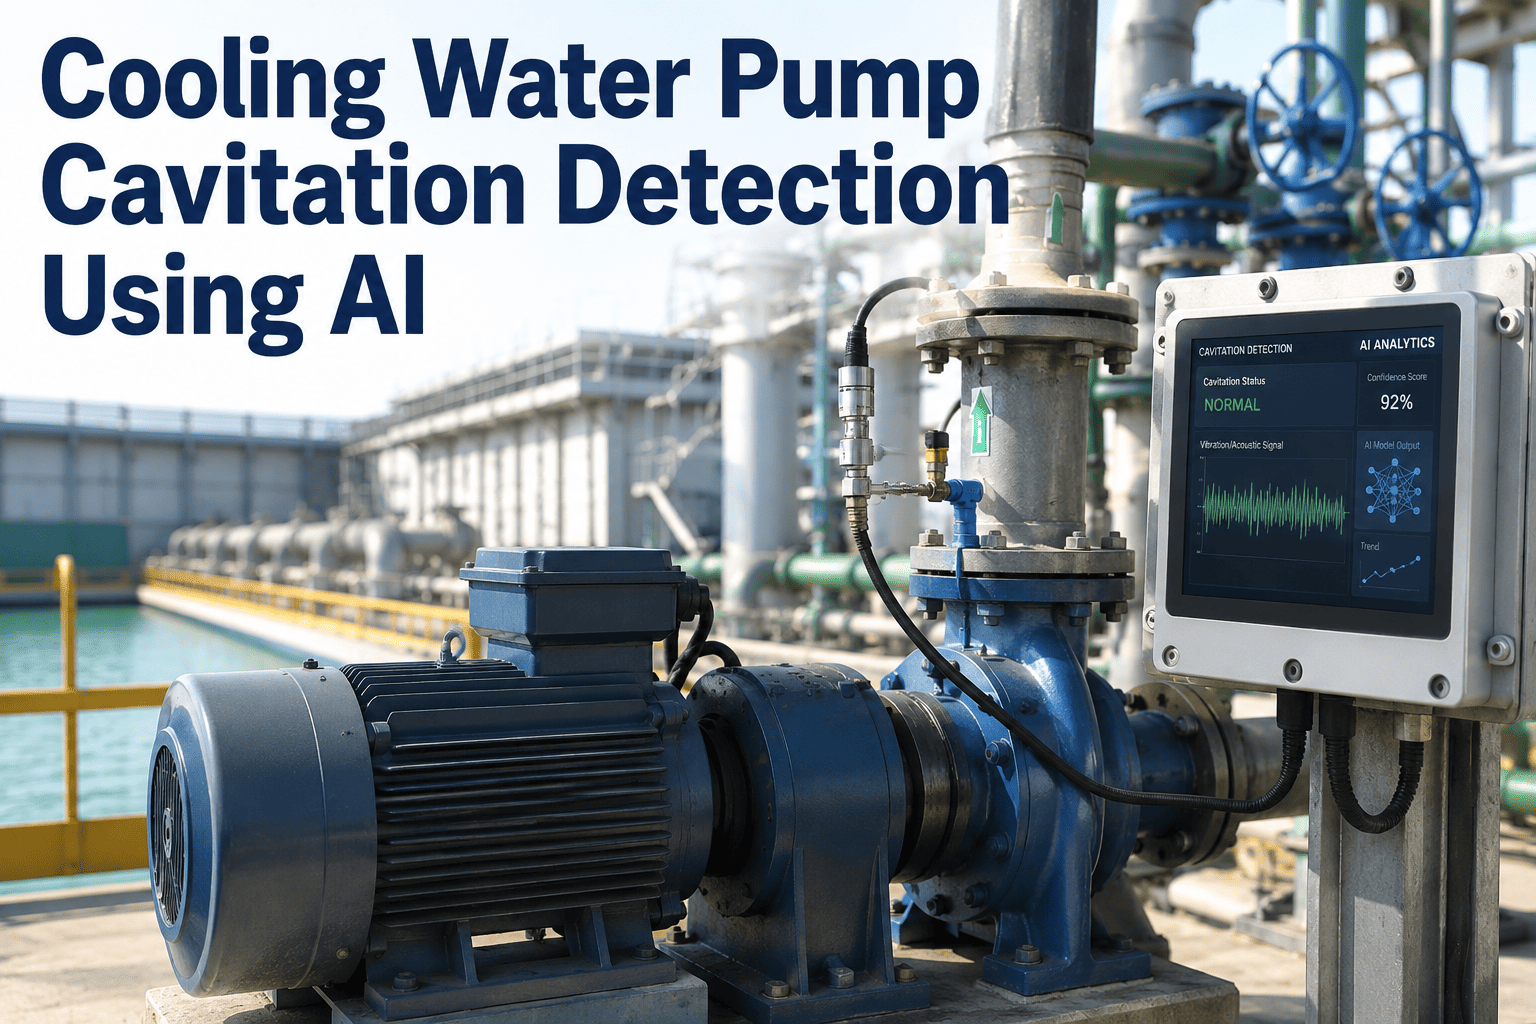
Cooling water pump cavitation is one of those failure modes that announces itself quietly — a faint crackling sound, a slight drop in flow, a vibration signature that has been there for weeks before anyone notices — and then destroys a pump impeller in a matter of days once it becomes acute. In a thermal power plant, a cooling water pump failure during peak summer load is not a maintenance event; it is a capacity crisis that forces a unit derate or full trip while the grid is most constrained. The traditional response is to schedule pump overhauls on fixed intervals and hope the calendar beats the failure curve. It rarely does. This guide covers the physics of cavitation, the AI vibration and acoustics signatures that betray it up to 96 hours before physical damage begins, and the CMMS workflow that converts that detection into a work order before any impeller metal is lost — showing how OxMaint's AI predictive maintenance platform is used by plant reliability teams to intercept cooling system failures before they become generation losses.
Pump Reliability · AI Vibration Analysis · Predictive Maintenance
Cavitation Is Telling You It Is There. Are You Listening?
The sound of imploding vapor bubbles at 4,000–20,000 Hz is detectable by an accelerometer long before a human ear notices anything wrong. That detection window is the difference between a scheduled impeller inspection and a $140,000 emergency replacement.
01
Vapor bubble formation
Local pressure at pump impeller inlet drops below fluid vapor pressure. Liquid flashes to vapor bubbles — typically when NPSH available falls below NPSH required.
→
02
Bubble collapse (implosion)
As bubbles move into higher-pressure regions, they collapse violently, releasing micro-jets at velocities up to 400 m/s. Each collapse generates a broadband acoustic emission detectable at the pump casing.
→
03
Impeller material erosion
Repeated micro-jet impacts fatigue the impeller vane surface, creating pitting and cratering. Erosion rate accelerates non-linearly — a pump running in moderate cavitation for 30 days may suffer 60% of its total erosion in the final 72 hours.
→
04
Performance degradation
Head-flow curve shifts left; pump can no longer meet system demand. Cooling water flow drops, condenser back-pressure rises, turbine output derated. Thermal protection trips unit if temperature limits are reached.
AI Detection: The Four Signatures of Cavitation Onset
AI vibration analytics does not simply look for "high vibration." It extracts specific spectral and statistical features from the accelerometer signal that are characteristic of vapor bubble collapse — features that are present even when overall vibration amplitude looks completely normal. This is why traditional vibration monitoring misses cavitation in its early stages.
Primary Signal
Broadband High-Frequency Energy (4–20 kHz)
Vapor bubble collapse generates a broadband acoustic emission with energy concentrated in the 4–20 kHz range. An AI model trained on pump-specific baselines detects elevation in this band 48–96 hours before the head-flow curve shows measurable deviation. Standard 1–1000 Hz monitoring misses this entirely.
Detection lead: 48–96 hours
Secondary Signal
Blade Pass Frequency Sidebands
Cavitation modulates the blade pass frequency (RPM × number of vanes / 60), creating sideband peaks that appear in the vibration spectrum. As cavitation worsens, sideband amplitude grows and the number of visible sidebands increases — a progression the AI model tracks continuously.
Detection lead: 24–72 hours
Secondary Signal
Kurtosis Elevation
Kurtosis measures the impulsiveness of the vibration time waveform. Bubble implosions are impulse events that elevate kurtosis above baseline even when RMS (overall vibration level) is still within acceptable limits. Kurtosis above 4.0 on a cooling pump with no known mechanical fault is a strong cavitation indicator.
Detection lead: 24–48 hours
Supporting Signal
NPSH Margin Calculation
OxMaint integrates flow, suction pressure, and fluid temperature data from the DCS to compute real-time NPSH available versus NPSH required. When the margin narrows below 1.3× the required value — even before vibration signatures appear — the system flags a cavitation risk and creates a pre-emptive inspection work order.
Detection lead: hours to days
From Detection to Closed Work Order: The OxMaint Workflow
Detecting cavitation is only half the equation. The other half is ensuring that detection reliably triggers a documented maintenance action — not just a dashboard alert that ages in an inbox. Here is the exact workflow OxMaint runs from sensor reading to closed work order.
01
Continuous sensor ingestion
Accelerometer data streams from pump bearing housings at 10 kHz sample rate into OxMaint's edge processing layer. NPSH parameters arrive every 30 seconds from DCS via OPC-UA. No manual data collection required.
02
AI signature extraction
OxMaint's model extracts broadband HF energy, kurtosis, and BPF sidebands from each analysis window. Each metric is compared against the asset-specific baseline established during the first 30 days of operation — not against generic ISO thresholds.
03
Cavitation probability score generated
A composite cavitation score (0–100) is updated every 15 minutes. When the score crosses the warning threshold (configurable, default 65), a pre-inspection alert fires. When it crosses the critical threshold (default 82), an immediate work order is auto-created.
04
Work order auto-created
Work order pre-populated with: asset ID, cavitation score history, vibration spectrum screenshots, NPSH trend, recommended inspection checklist, and required spare parts (mechanical seal kit, wear ring set). Assigned to qualified rotating equipment technician on next shift.
05
Root cause investigation
Technician verifies NPSH margin, checks suction line strainer for blockage, inspects inlet valve for partial closure. Findings documented in the mobile app — root cause tagged (suction head loss, operation off-curve, fouled strainer, excessive flow demand) for trend analysis across pump fleet.
06
Resolution logged and closed
Corrective action recorded (strainer cleaned, operating point adjusted, suction valve opened). Before/after vibration readings attached. Work order closed with full audit trail. OxMaint monitors post-maintenance vibration trend to confirm resolution — reopens WO automatically if cavitation signature returns within 72 hours.
From cavitation signal to closed work order
Stop Discovering Pump Damage During Inspection. Start Preventing It.
OxMaint connects your pump vibration data to automated work orders — so your team intervenes while the impeller is still intact, not after it has been eroded to a replacement cost.
The Cost Math: Early Detection vs Late Discovery
The financial case for AI cavitation detection is not complicated. It comes down to one comparison: the cost of a condition-triggered inspection versus the cost of an emergency impeller replacement during a heat wave.
Late Discovery (Calendar PM or Reactive)
Emergency impeller replacement
$35,000 – $85,000
Pump casing inspection and re-machining
$12,000 – $28,000
Expedited parts procurement (air freight)
$8,000 – $18,000
Unit derate revenue loss (72 hrs @ 200 MW)
$120,000 – $340,000
Bearing and seal replacement (secondary damage)
$6,000 – $14,000
Total incident cost: $181,000 – $485,000
VS
Early Detection (OxMaint AI)
Cavitation inspection work order (2 hrs labor)
$180 – $420
Suction strainer cleaning or valve adjustment
$200 – $600
Wear ring replacement (if minor erosion found)
$1,800 – $4,200
Generation impact (planned 4-hr maintenance window)
$0 (off-peak scheduled)
OxMaint monitoring (monthly, per pump)
Included in platform
Total intervention cost: $2,200 – $5,200
35–90×
Cost savings ratio — early AI detection versus late reactive repair for a single cooling water pump cavitation event
Frequently Asked Questions
Q1 What sensors do we need to detect cavitation with AI, and can we use what we already have?
In most cases you can use existing accelerometers, provided they are rated to at least 10 kHz — the frequency range where cavitation signatures are strongest. The key is sensor placement: the accelerometer should be mounted on the pump bearing housing on the impeller side (drive-end bearing is less sensitive for cavitation detection). If your current sensors are standard process vibration transmitters with 1–1000 Hz range, OxMaint can still extract useful cavitation indicators from the NPSH data in your DCS. Many plants start with the process data integration and add HF accelerometers at the next maintenance window.
Start a free trial to see a sensor suitability assessment for your pump fleet.
Q2 How does AI distinguish cavitation vibration from normal pump vibration at high load?
This is the key advantage of asset-specific baselines over generic thresholds. OxMaint establishes a baseline for each pump at each load point during the first 30 days of monitoring — capturing what normal high-load vibration looks like for that specific impeller, volute, and system. When cavitation begins, the AI identifies the change in spectral shape and kurtosis relative to that baseline, not relative to a catalog threshold. A pump that normally runs at 8 mm/s RMS at high load will trigger a cavitation alert when kurtosis elevates at 8 mm/s — whereas a generic 10 mm/s threshold would not flag it at all.
Book a demo to see this baseline comparison on a live pump example.
Q3 Can cavitation be corrected without taking the pump offline?
In many cases, yes — particularly when the root cause is correctable without physical pump access. Suction strainer blockage can be cleared through the isolation bypass while the pump continues operating on reduced flow. Operating point adjustment (reducing demand flow to move the pump back onto its best efficiency point curve) can be done from the control room. Suction valve partial closure is catchable in a walkdown inspection. The value of early AI detection is that it gives your team time to diagnose the root cause and attempt an online fix before the only option becomes an emergency shutdown and impeller inspection.
Q4 How quickly can OxMaint be deployed on our cooling water pump fleet?
For a cooling water pump fleet with existing accelerometers and a DCS historian, OxMaint deployment typically runs 3 to 5 weeks. Week 1 covers asset setup and data connection via OPC-UA or API to the historian. Weeks 2 to 4 run the baseline learning period — the AI model establishes normal vibration signatures at each operating load point. Week 5 activates alert thresholds and work order automation. Most plants see their first AI-triggered cavitation inspection work orders within the first 60 days of live operation, typically catching conditions the calendar PM schedule would not have reached for another 2 to 4 months.
Q5 What is the false alarm rate for AI cavitation detection, and how is it managed?
False alarm rates are highest in the first 30 days before the baseline is fully established — typically 15 to 25% of alerts during this period are false positives. After baseline stabilization, false positive rates fall below 8% for well-instrumented pumps. OxMaint manages this through a shadow mode configuration during onboarding where alerts generate review flags rather than work orders, allowing your reliability engineer to confirm and refine thresholds before full automation. Every false positive feeds back into the model to improve specificity. Most plants run full auto-WO creation with less than 5% false alarms by month 3.
Protect your cooling system
Your Cooling Pumps Are Running. Are They Cavitating Right Now?
Without AI vibration monitoring, the answer is unknowable until the next PM inspection — or until the impeller failure forces the answer. OxMaint gives your cooling pump fleet continuous cavitation surveillance and automatic work order creation the moment a pre-failure signature appears. Protect the impeller. Protect the generation commitment.