Power plant maintenance teams that walk into daily reliability meetings without live data are flying blind — and every hour of delay costs real generation revenue. In most plants, the morning stand-up still runs on last night's printouts, shift handover notes, and memory from the outgoing supervisor. By the time a degrading asset shows up in a weekly KPI report, the root cause has already had two or three days to compound. A modern reliability dashboard changes that equation: every open work order, every overdue PM, every sensor threshold breach, and every critical spare below minimum stock level is visible in one screen before the first technician walks onto the plant floor. To see how OxMaint's analytics and reporting module runs daily reliability meetings for power plant teams, start a free trial or book a 30-minute walkthrough with a power plant specialist.
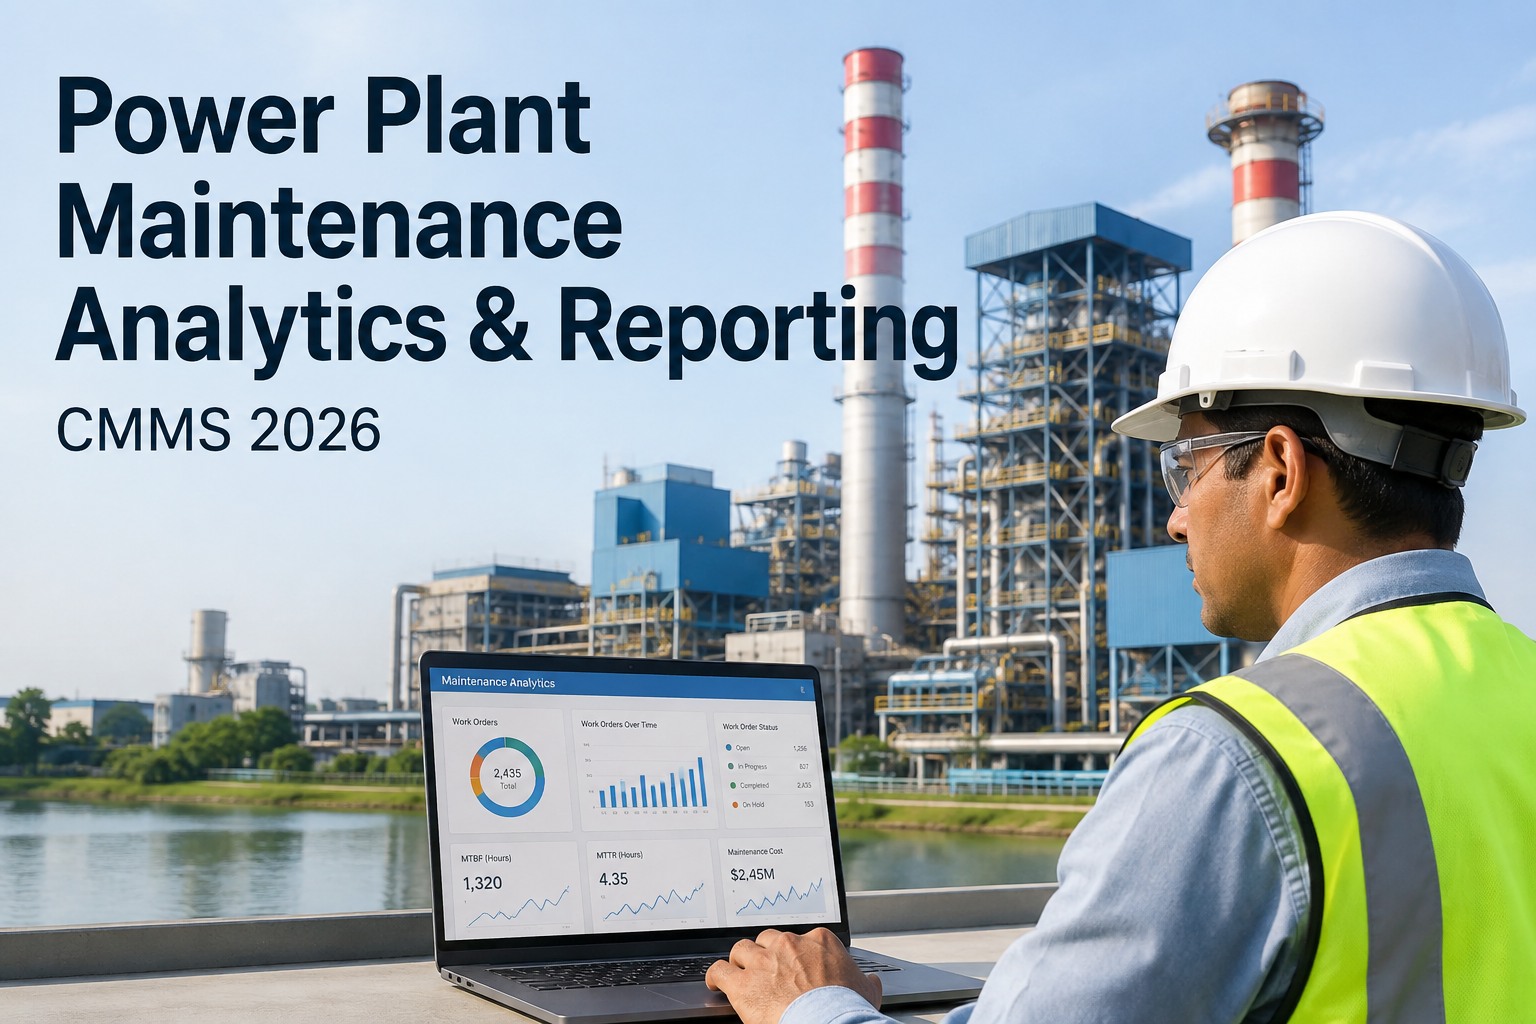
Analytics & Reporting · Power Plant CMMS · Maintenance Management
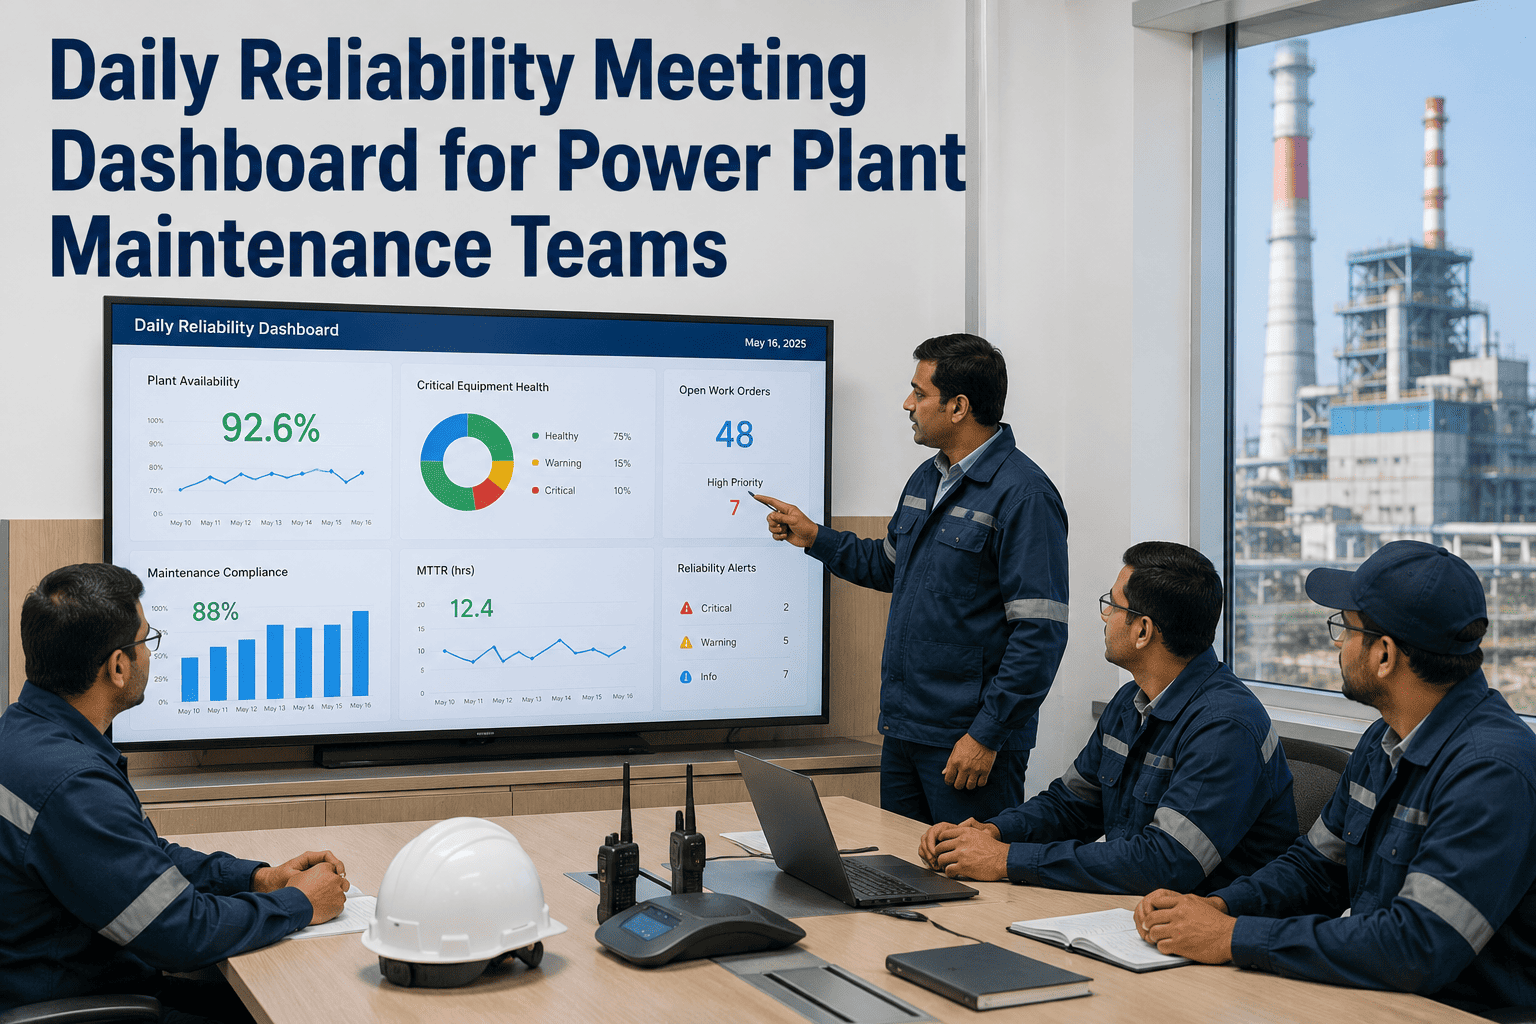
Daily Reliability Meeting Dashboard for Power Plant Maintenance Teams
Stop walking into your 7 AM stand-up with last night's printouts. OxMaint's live reliability dashboard gives every technician, planner, and plant manager a single source of truth — before the first wrench turns.
90–120 min
Saved daily — no manual KPI compilation before stand-up
10–25%
MTTR reduction within 60 days of structured CMMS deployment
40–60%
Drop in unplanned failures after connecting sensor data to CMMS
Why Your Morning Reliability Meeting Is Broken
The problem isn't the meeting. It's the data arriving too late, from too many places, in a format nobody can act on in real time.
01
Stale Shift Reports
Handover notes written at 6 AM describe problems from 11 PM. By the time a failing bearing appears in the log, it has been trending for hours with no work order raised.
02
Scattered Data Sources
Work orders in the CMMS, alarms in the DCS, parts levels in a spreadsheet, PM compliance in a separate report — nobody sees the full picture without assembling it manually.
03
No Asset Context
A technician reports a vibration anomaly on Turbine 2. Without maintenance history, nobody knows if it's the third occurrence this month or a first-ever reading. Decisions are made blind.
04
Reactive Prioritization
Without live backlog visibility, the loudest supervisor wins the crew. High-criticality PMs slip while low-urgency breakdowns get all the attention — and forced outages follow.
What a Live Reliability Dashboard Shows — Before 7 AM
OxMaint surfaces six layers of operational intelligence automatically, so your morning meeting starts with decisions, not data-gathering.
Assets Requiring Attention
Turbine 3 — Bearing Temp High
Cooling Tower A — PM Overdue 3d
Generator 1 — Vibration Trending Up
HRSG Feed Pump — Inspection Due Today
The 6 KPIs Every Power Plant Reliability Meeting Needs
These are not generic maintenance metrics — they are the specific data points that predict forced outages before they happen in power generation operations.
MTTR
Mean Time to Repair
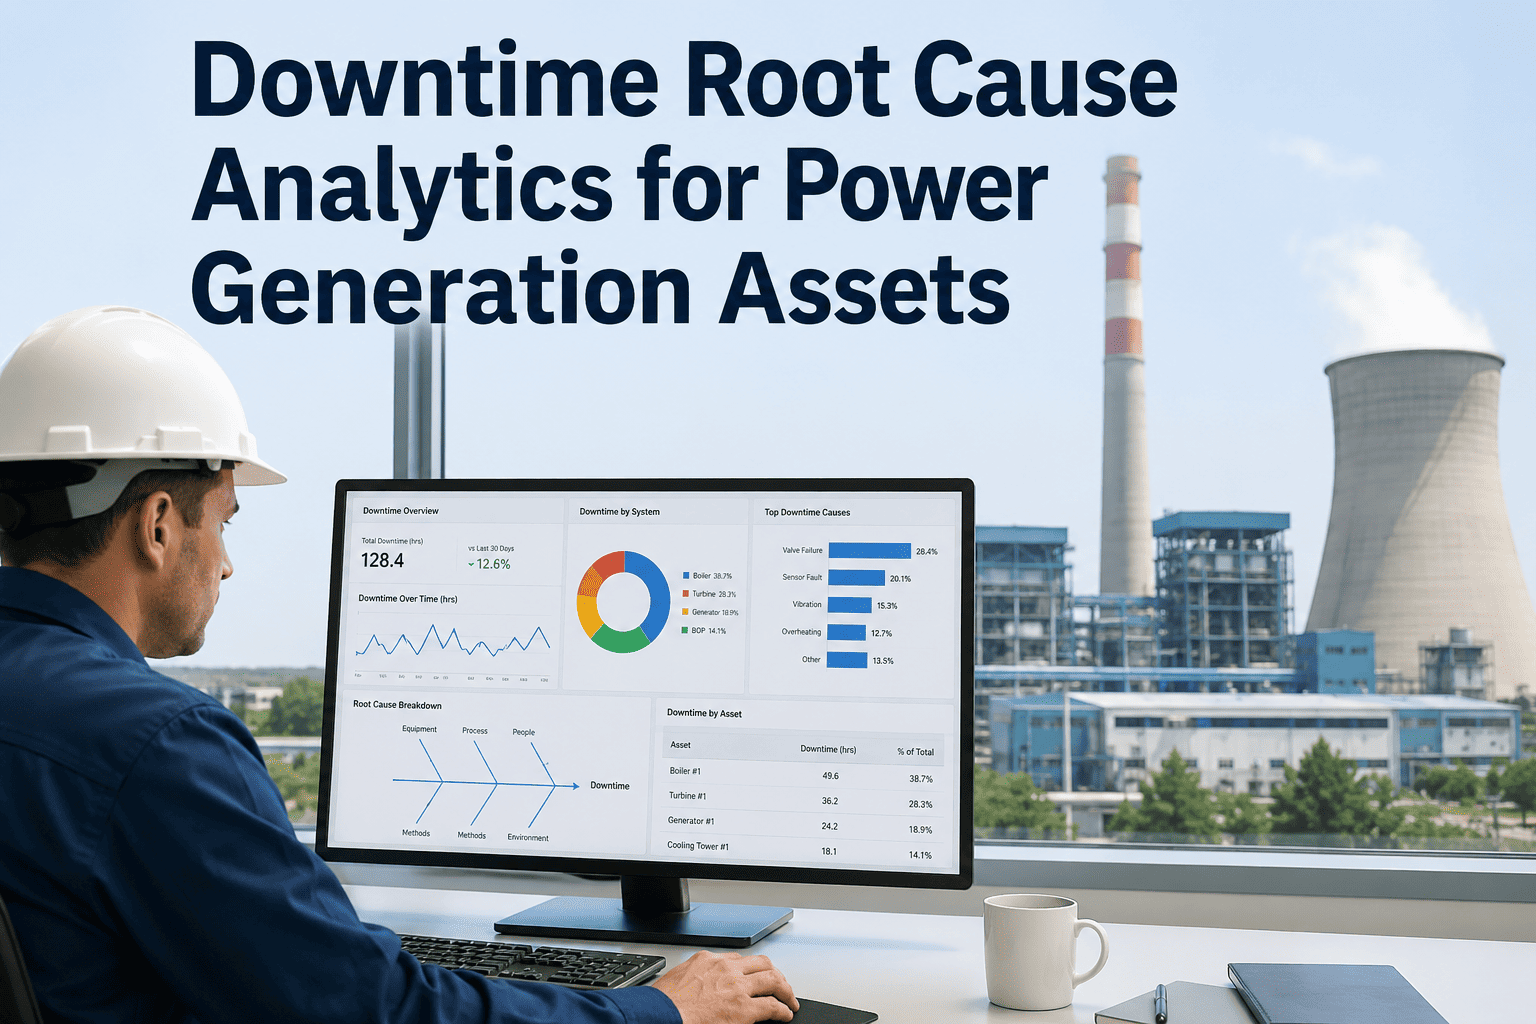
Tracks how long each repair takes from fault detection to restoration. CMMS links parts availability, technician routing, and historical repair data to cut MTTR by 10–25% within 60 days.
MTBF
Mean Time Between Failures
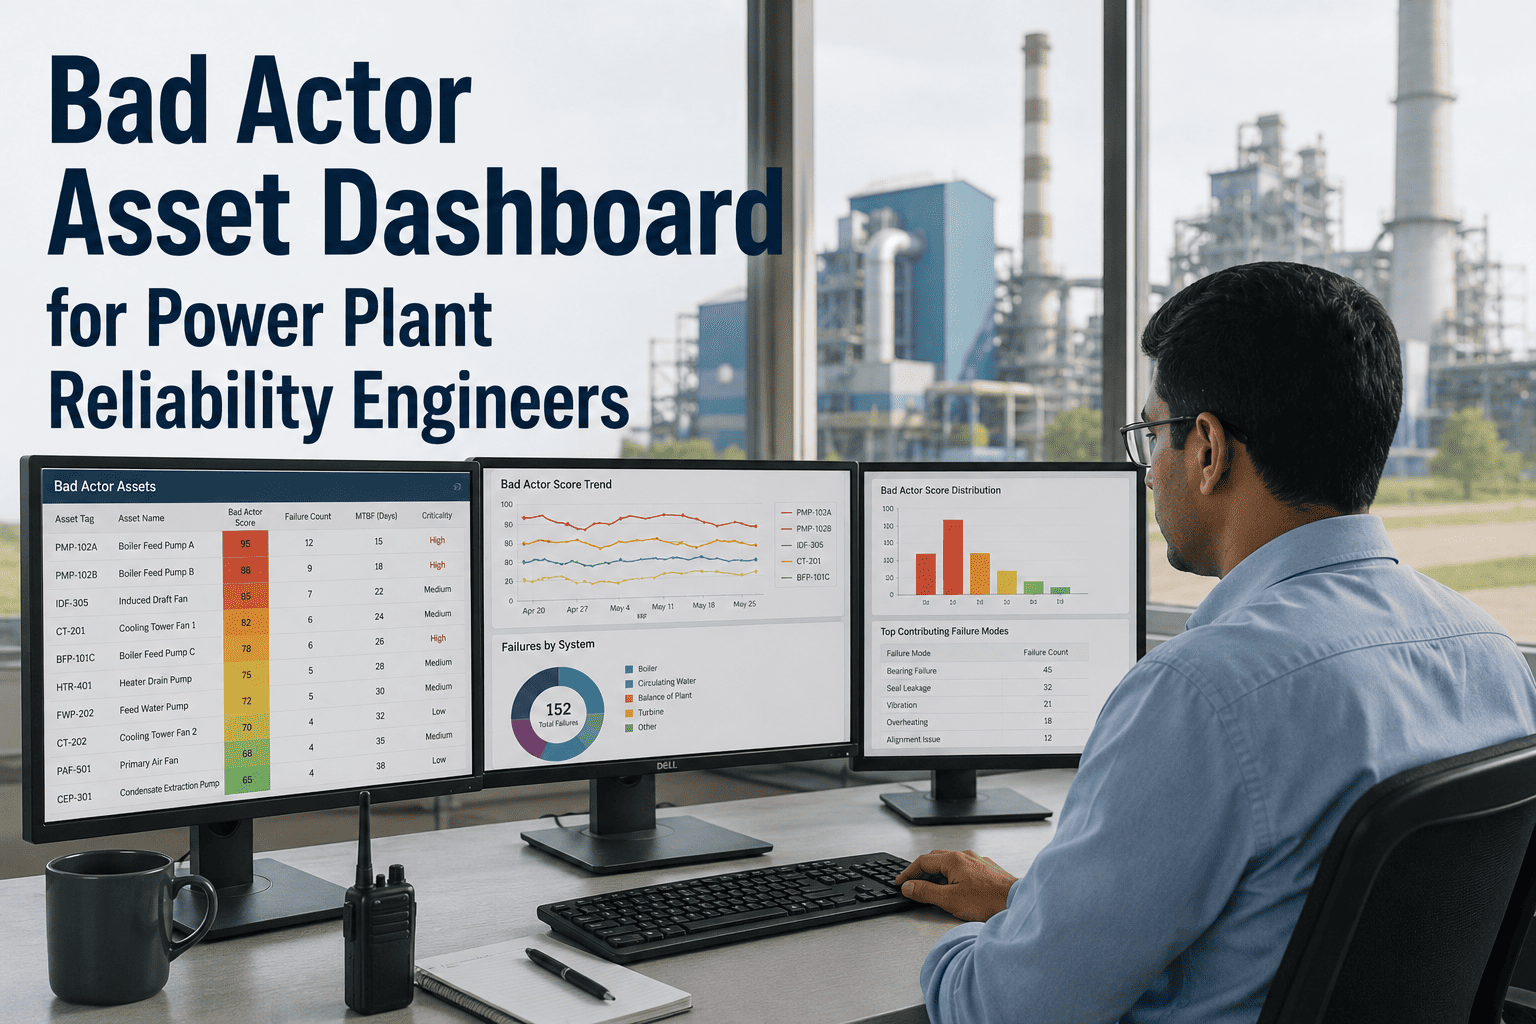
The clearest single indicator of whether your maintenance program is actually improving asset reliability or just reacting to the same failures on a shorter cycle.
PMC
PM Compliance Rate
The most predictive leading indicator of unplanned outage risk. Plants below 85% PM compliance see forced outage rates double compared to plants at 95%+. OxMaint tracks this live.
WO
Planned vs Unplanned Work Ratio
The ratio of reactive to proactive work orders is the clearest single measure of maintenance maturity. Best-in-class power plants run 80%+ planned work. Most plants start below 50%.
BP
Backlog Health
A growing backlog of overdue critical work orders is the earliest warning signal for a forced outage. OxMaint ages and prioritizes the backlog automatically so nothing critical goes invisible.
AI
Sensor Alert Response Time
Time from condition monitoring alert to work order creation. Plants connecting IoT sensor data to CMMS work order triggers achieve 40–60% reduction in unplanned bearing and gearbox failures.
Run Your Reliability Meeting From One Screen
OxMaint's analytics dashboard is pre-built for power generation KPIs — not a generic BI tool requiring months of custom configuration. Live data, role-based views, mobile-ready.
How OxMaint Builds Your Daily Reliability Brief — Automatically
From shift end to meeting start, here is how the data flows without anyone building a report manually.
1
Technicians Close Work Orders on Mobile
Field crew completes tasks on the OxMaint app — adding photos, meter readings, and findings — without returning to a desktop. Every closure timestamps against the asset record in real time.
2
Sensor Thresholds Trigger Automatic Alerts
When vibration, temperature, or current readings breach configured limits, OxMaint creates an investigation work order automatically — no manual alarm-to-CMMS translation required.
3
Dashboard Refreshes in Real Time
All KPIs — MTTR, PM compliance, backlog aging, crew loading, spare parts alerts — update continuously. By 6:55 AM, the dashboard your team walks into reflects the last 8 hours exactly.
4
Role-Based Views for Every Attendee
The plant manager sees fleet reliability scores. The planner sees crew loading and PM backlog. The reliability engineer sees condition trending. One system, three different screens, zero report-building.
5
Action Items Assigned Before the Meeting Ends
Work orders created or reassigned directly from the dashboard during the meeting. Every decision is logged, assigned, and visible to the field crew before they leave the room.
OxMaint Dashboard vs Legacy Reporting — Head to Head
The difference between a dashboard that prevents outages and one that just describes them after the fact.
| Capability |
Spreadsheet / Manual Report |
OxMaint Live Dashboard |
| Data freshness |
12–24 hours old at meeting time |
Real-time, continuous refresh |
| KPI compilation time |
90–120 minutes per morning |
Zero — auto-generated overnight |
| Sensor alert integration |
Manual transfer from DCS log |
Auto work order on threshold breach |
| Crew loading visibility |
Whiteboard or shift note |
Live headcount and skill matching |
| Asset history at meeting |
Not available without separate lookup |
Full failure and PM history per tap |
| Action item tracking |
Meeting minutes in email |
Work order raised and assigned in-room |
| Audit readiness |
Weeks of manual compilation |
One-click export, any date range |
Frequently Asked Questions
What KPIs should a power plant track in daily reliability meetings?
The six KPIs that matter most are MTTR, MTBF, PM compliance rate, planned-vs-unplanned work order ratio, backlog health by criticality, and sensor alert response time. PM compliance is the single most predictive leading indicator of forced outage risk — plants below 85% see failure rates roughly double.
OxMaint tracks all six automatically without manual compilation.
How long does it take to set up OxMaint's reliability dashboard for a power plant?
Most single-site plants are fully operational — asset hierarchy loaded, KPI thresholds configured, mobile work orders live — within one to three days. The analytics dashboard runs from day one using your existing work order data, with no custom BI configuration required.
Book a demo to see a live walkthrough.
Can the dashboard connect to our DCS or historian for sensor data?
Yes. OxMaint connects to DCS, SCADA, and historian platforms via REST API and OPC-UA. When a sensor reading breaches a configured threshold, OxMaint automatically creates a priority work order — no manual alarm-to-CMMS translation. This is what drives the 40–60% reduction in unplanned bearing and gearbox failures reported by plants using connected condition monitoring.
Can different roles see different dashboard views?
Yes. OxMaint supports role-based dashboard configuration: the plant manager sees fleet reliability scores and cost trends; the maintenance planner sees crew loading and backlog aging; the reliability engineer sees asset condition trending and failure history. Each view pulls from the same live data — no separate reports, no version mismatches between teams.
How does a live dashboard help with NERC CIP or OSHA compliance?
OxMaint maintains a continuous, timestamped audit trail of every work order, inspection, and maintenance action. OSHA's 2026 electronic recordkeeping rules require digital evidence capture on every safety record — OxMaint satisfies this automatically.
Start a free trial to see audit-ready reporting in practice.
Turn Your 7 AM Stand-Up Into a Decision-Making Meeting
Stop spending the first 90 minutes of every day building the report. OxMaint's reliability dashboard delivers every KPI your team needs — live, role-specific, and ready before the first shift walks in. Deploy in days, not months.