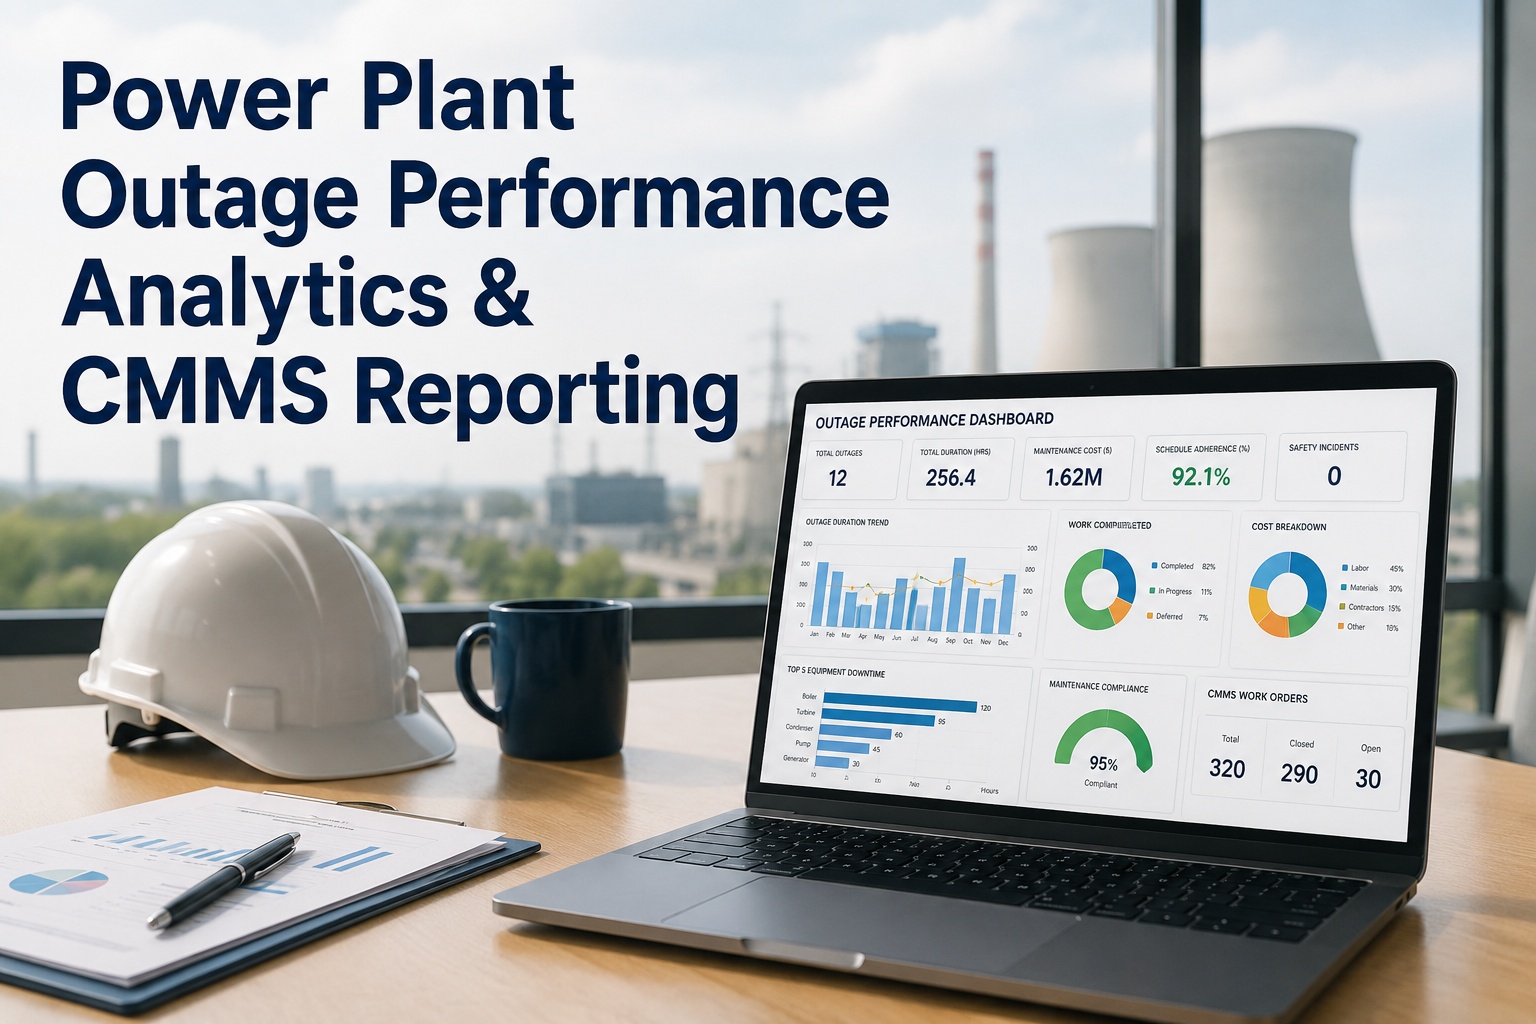
Grid reliability is measured in seconds, but the decisions that protect it happen days and weeks in advance — in maintenance work orders, PM schedules, inspection checklists, and spare parts storerooms. When a gas turbine trips on a 97°F July afternoon because a lube oil cooler fouling went undetected for three months, the root cause isn't the heat. It's a maintenance program that had no visibility into the asset's degradation trend. For power plant operators under increasing reliability pressure from NERC, ISOs, and utility offtake partners, a grid resilience maintenance dashboard isn't a reporting tool — it's an operational nerve center. OxMaint gives plant teams real-time KPI dashboards, mobile work orders, AI-triggered alerts, and asset history in one platform built specifically for power generation. Explore OxMaint free, or book a 30-minute demo to see the dashboard configured for your asset types.
FEATURE PAGE · ANALYTICS & REPORTING · GRID RELIABILITY
The Dashboard That Tells You Your Next Forced Outage — Before It Happens
Real-time MTTR, MTBF, PM compliance, asset condition scores, and work order velocity — all in a single view built for power generation reliability. No spreadsheets. No end-of-month surprises.
50%
Reduction in unplanned downtime for teams using CMMS analytics dashboards
30 days
How old a monthly spreadsheet report is when it arrives — useless for real-time decisions
85%+
PM completion rate target — teams below this see 2–3x higher forced outage rates
25%
Typical MTTR reduction within 60 days of structured CMMS dashboard deployment
THE VISIBILITY GAP
What Your Maintenance Program Can't See Right Now
Most power plant maintenance teams make critical scheduling, capital, and reliability decisions based on gut feel and month-old spreadsheets. Here's what that costs — and what a real-time dashboard changes.
The Problem
90–120 Minutes Every Morning
Daily KPI summaries built from CMMS exports, spreadsheets, and shift notes. By the time the report is ready, the operational window it was meant to inform has closed.
OxMaint fix: Live dashboard, zero morning build time
The Problem
Corrective Trends Appear Too Late
By the time a failure pattern shows up in a weekly report, the root cause has had days to repeat — and the next failure is already in progress on an adjacent asset.
OxMaint fix: Failure pattern alerts surface in real time, not next week
The Problem
Capital Requests Without Asset Data
CapEx decisions get approved or rejected without per-asset cost history — leading to chronic under-investment in high-risk equipment and overspending on low-risk assets.
OxMaint fix: Per-asset total cost of ownership from day one
The Problem
PM Compliance Is a Guess
Managers believe PM completion rates are around 80%. Actual rates, when measured, are typically 55–65%. The gap is where forced outages live.
OxMaint fix: Real PM compliance rate, updated continuously
THE DASHBOARD MODULES
Six Views That Cover Your Entire Reliability Picture
OxMaint's grid resilience dashboard is pre-built with the KPI modules power generation teams actually use — no custom BI configuration, no consultant engagement, no waiting.
RELIABILITY CORE
MTTR · MTBF · Availability
Mean time to repair and mean time between failures, calculated automatically from work order open and close timestamps. Availability percentage by asset class and unit. Benchmarks shift decisions from instinct to numbers — start with these two, and PM compliance follows naturally within 60 days.
MTTR by asset class
MTBF trend (90-day)
Unit availability %
WEFOR tracking
PM HEALTH
PM Compliance & Backlog
Planned maintenance percentage, on-time completion rate, and days-past-due backlog by crew and asset class. Critical PM overdue flagging with escalation paths. Teams with PM compliance above 85% consistently see 2–3x lower forced outage rates than teams below 65%.
On-time PM rate %
Overdue PM count
PMP (planned maintenance %)
Backlog aging
CONDITION
Asset Condition Scores
Composite health scores per critical asset, combining sensor trends, inspection results, and failure history. Red/amber/green scoring at a glance — without opening individual asset records.
WORK ORDERS
Work Order Velocity
Open work orders by priority, age, and crew assignment. Identifies bottlenecks — which technicians are overloaded, which assets keep generating reactive work, which priority-1 jobs are aging past SLA.
COST
Maintenance Cost Trending
Maintenance cost per MWh produced, labor hours by asset class, and parts spend trending. The data that supports CapEx requests and identifies assets approaching economic replacement threshold.
COMPLIANCE
NERC & Regulatory Tracking
NERC PRC-005, CIP compliance task completion, and inspection records — audit-ready with timestamped evidence attached directly to work orders. No separate tracking system required.
OXMAINT · GRID RELIABILITY DASHBOARD · POWER PLANT CMMS
Stop Making Reliability Decisions on Last Month's Data
OxMaint gives power plant operators live MTTR, MTBF, PM compliance, and asset condition scores — updated in real time from work orders already flowing through your maintenance team.
MOBILE-FIRST OPERATIONS
From Control Room to Field — The Same Dashboard, Every Device
Grid resilience isn't just a leadership view. It depends on technicians in the field closing work on time, capturing inspection findings accurately, and flagging anomalies before they escalate. OxMaint mobile brings the full work order and asset record to every technician's phone — no desktop required.
Technician View
Assigned work orders, step-by-step procedure checklists, asset manuals, and photo capture — all accessible offline on mobile. Completion timestamps feed the KPI dashboard automatically.
Supervisor View
Real-time work order status by crew, overdue flag alerts, permit-to-work approval, and crew workload balancing — from any device, anywhere on site or off.
Plant Manager View
Plant availability, critical asset status, PM compliance rate, and cost-per-MWh trend — the four numbers that define plant health, always current, no spreadsheet required.
AI Alert View
Condition-based alerts that surface when sensor trends deviate from baseline — pushed to the right person with severity scoring, asset context, and recommended action pre-attached to an auto-generated work order.
GRID RELIABILITY IMPACT
What Changes When You Can See Your Reliability Data in Real Time
10–25%
MTTR reduction within 60 days
Faster fault routing via mobile work orders, pre-staged parts from CMMS-linked inventory, and faster diagnosis from attached asset history reduce repair time at every step.
85%+
PM compliance target within 90 days
Visible overdue flagging, supervisor escalation alerts, and mobile technician dispatch eliminate the PM slippage that drives corrective maintenance spikes.
2–3x
Lower forced outage rate vs teams below 65% PM compliance
The single most predictive metric for grid availability is planned maintenance percentage. Every percentage point of PM compliance above 65% measurably reduces forced outage frequency.
FREQUENTLY ASKED
Grid Resilience Dashboard Questions
How long does it take to get live MTTR and MTBF data in OxMaint?
MTTR begins calculating from the first work order created and closed in OxMaint. Teams with historical CMMS data can import records to get trended MTBF from day one. For plants starting fresh, meaningful trend data is typically available within 30–45 days of operation.
Sign up free and see the dashboard with your first work orders.
Can OxMaint dashboards be shared with external stakeholders like utility partners or regulators?
Yes. OxMaint supports configurable role-based access — so utility offtake partners, corporate ownership groups, or NERC auditors can be given read-only dashboard access scoped to specific KPIs and asset classes. No data export required, and access is revocable at any time.
Does OxMaint integrate with existing SCADA or DCS systems to pull condition data?
OxMaint connects to SCADA and DCS systems via OPC-UA, Modbus, DNP3, and PI Historian. Sensor data feeds directly into asset condition records and the dashboard's health scoring.
Book a demo to walk through the integration workflow for your plant's control system.
Which KPI should a plant focus on first when starting a reliability improvement program?
Start with planned maintenance percentage (PMP) and MTTR — both show measurable improvement within 30–60 days and require no capital investment, only process discipline and a reliable work order system. MTBF improvement follows naturally as PMP climbs above 85% over 6–12 months.
What's the difference between OxMaint and a generic BI tool like Power BI for this use case?
Generic BI tools require custom data modeling, connector configuration, and ongoing maintenance by an analytics team. OxMaint's dashboard is pre-built with power generation KPI logic — WEFOR, MTBF, PM compliance, and cost-per-MWh are calculated automatically from work order data, with no custom setup.
See it live versus spending weeks building a Power BI model from scratch.
OXMAINT · RELIABILITY ANALYTICS · POWER PLANT CMMS
Real-Time Grid Resilience Starts with Real-Time Maintenance Visibility
OxMaint gives power plant operators a pre-built analytics dashboard with live MTTR, MTBF, PM compliance, asset condition scores, and NERC compliance tracking — deployed in weeks, not months.